|
|
| . |
. |
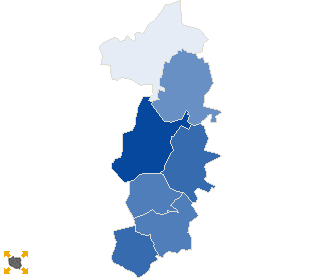
Voting results |
. |
. |
| . |
. |
| . |
. |
. |
. |
. |
. |
. |
. |
. |
. |
. |
. |
| No. |
Name |
No. entitled
to vote |
No. of ballot
papers issued |
No. of |
No. of total votes / No. entitled to vote
[%] |
| total votes |
valid votes |
| 120201 | Borzęcin, gm. | 6500 | 1524 | 1524 | 1483 | 23.45 |  |
| 120202 | Brzesko, gm. | 28313 | 7865 | 7860 | 7736 | 27.76 | |
| 120203 | Czchów, gm. | 7086 | 1738 | 1738 | 1693 | 24.53 | |
| 120204 | Dębno, gm. | 10745 | 2754 | 2754 | 2686 | 25.63 | |
| 120205 | Gnojnik, gm. | 5634 | 1346 | 1346 | 1296 | 23.89 | |
| 120206 | Iwkowa, gm. | 4578 | 1145 | 1145 | 1114 | 25.01 | |
| 120207 | Szczurowa, gm. | 7802 | 1404 | 1401 | 1366 | 17.96 | |
| |
brzeski |
70658 |
17776 |
17768 |
17374 |
25.15 |
 |
|
| |
| . |
. |
Turnout by location of ward electoral commission |
. |
. |
| . |
. |
| . |
. |
. |
. |
. |
. |
. |
. |
. |
. |
. |
. |
| No. |
Name |
No. entitled
to vote |
No. of ballot
papers issued |
No. of |
No. of total votes / No. entitled to vote
[%] |
| total votes |
valid votes |
| 1 | City | 15733 | 4980 | 4978 | 4917 | 31.64 | |
| 2 | Country | 54925 | 12796 | 12790 | 12457 | 23.29 | |
| . |
Turnout by number of inhabitants of commune |
. |
| 1 | to 5 000 | 0 | 0 | 0 | 0 | 0.00 | |
| 2 | from 5 001 to 10 000 | 31600 | 7157 | 7154 | 6952 | 22.64 | |
| 3 | from 10 001 to 20 000 | 10745 | 2754 | 2754 | 2686 | 25.63 | |
| 4 | from 20 001 to 50 000 | 28313 | 7865 | 7860 | 7736 | 27.76 | |
| 5 | from 50 001 to 100 000 | 0 | 0 | 0 | 0 | 0.00 | |
| 6 | from 100 001 to 200 000 | 0 | 0 | 0 | 0 | 0.00 | |
| 7 | from 200 001 to 500 000 | 0 | 0 | 0 | 0 | 0.00 | |
| 8 | over 500 000 | 0 | 0 | 0 | 0 | 0.00 | |
|
|


 Statistical DataLegal ActsElectoral BodiesElection Committees and CandidatesTurnoutResultsSearchDocumentsCreated by