|
|
|
|
| |
| . |
. |
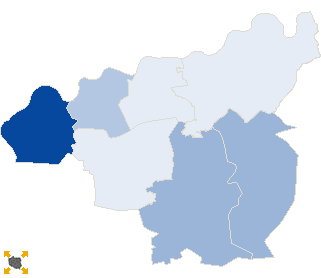
Turnout by location of ward electoral commission |
. |
. |
| . |
. |
| . |
. |
. |
. |
. |
. |
. |
. |
. |
. |
. |
. |
| No. |
Name |
No. entitled
to vote |
No. of ballot
papers issued |
No. of |
No. of total votes / No. entitled to vote
[%] |
| total votes |
valid votes |
| 1 | City | 13878 | 3399 | 3397 | 3327 | 24.48 |  |
| 2 | Country | 32961 | 6570 | 6568 | 6414 | 19.93 | |
| . |
Turnout by number of inhabitants of commune |
. |
| 1 | to 5 000 | 8162 | 1896 | 1896 | 1854 | 23.23 | |
| 2 | from 5 001 to 10 000 | 11625 | 2359 | 2359 | 2314 | 20.29 | |
| 3 | from 10 001 to 20 000 | 10593 | 2028 | 2024 | 1948 | 19.11 | |
| 4 | from 20 001 to 50 000 | 16459 | 3686 | 3686 | 3625 | 22.40 | |
| 5 | from 50 001 to 100 000 | 0 | 0 | 0 | 0 | 0.00 | |
| 6 | from 100 001 to 200 000 | 0 | 0 | 0 | 0 | 0.00 | |
| 7 | from 200 001 to 500 000 | 0 | 0 | 0 | 0 | 0.00 | |
| 8 | over 500 000 | 0 | 0 | 0 | 0 | 0.00 | |
|
|


 Statistical DataLegal ActsElectoral BodiesElection Committees and CandidatesTurnoutResultsSearchDocumentsCreated by