|
|
| . |
. |
Voting results |
. |
. |
| . |
. |
| . |
. |
. |
. |
. |
. |
. |
. |
. |
. |
. |
. |
| No. |
Name |
No. entitled
to vote |
No. of ballot
papers issued |
No. of |
No. of total votes / No. entitled to vote
[%] |
| total votes |
valid votes |
| 120502 | Biecz, gm. | 13509 | 2631 | 2630 | 2567 | 19.47 |  |
| 120503 | Bobowa, gm. | 6937 | 1803 | 1800 | 1753 | 25.95 | |
| 120504 | Gorlice, gm. | 13020 | 2899 | 2886 | 2795 | 22.17 | |
| 120501 | Gorlice, m. | 24472 | 6584 | 6579 | 6441 | 26.88 | |
| 120505 | Lipinki, gm. | 5432 | 1177 | 1177 | 1152 | 21.67 | |
| 120506 | Łużna, gm. | 6401 | 1291 | 1291 | 1242 | 20.17 | |
| 120507 | Moszczenica, gm. | 3733 | 605 | 605 | 599 | 16.21 | |
| 120508 | Ropa, gm. | 3827 | 952 | 951 | 924 | 24.85 | |
| 120509 | Sękowa, gm. | 3859 | 821 | 821 | 807 | 21.27 | |
| 120510 | Uście Gorlickie, gm. | 4998 | 1161 | 1161 | 1124 | 23.23 | |
| |
gorlicki |
86188 |
19924 |
19901 |
19404 |
23.09 |
 |
|
| |
| . |
. |
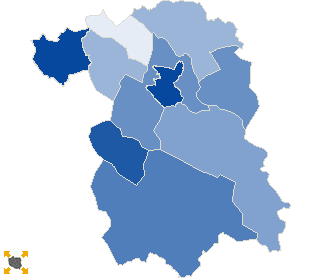
Turnout by location of ward electoral commission |
. |
. |
| . |
. |
| . |
. |
. |
. |
. |
. |
. |
. |
. |
. |
. |
. |
| No. |
Name |
No. entitled
to vote |
No. of ballot
papers issued |
No. of |
No. of total votes / No. entitled to vote
[%] |
| total votes |
valid votes |
| 1 | City | 30541 | 8199 | 8194 | 8012 | 26.83 | |
| 2 | Country | 55647 | 11725 | 11707 | 11392 | 21.04 | |
| . |
Turnout by number of inhabitants of commune |
. |
| 1 | to 5 000 | 7592 | 1426 | 1426 | 1406 | 18.78 | |
| 2 | from 5 001 to 10 000 | 27595 | 6384 | 6380 | 6195 | 23.12 | |
| 3 | from 10 001 to 20 000 | 26529 | 5530 | 5516 | 5362 | 20.79 | |
| 4 | from 20 001 to 50 000 | 24472 | 6584 | 6579 | 6441 | 26.88 | |
| 5 | from 50 001 to 100 000 | 0 | 0 | 0 | 0 | 0.00 | |
| 6 | from 100 001 to 200 000 | 0 | 0 | 0 | 0 | 0.00 | |
| 7 | from 200 001 to 500 000 | 0 | 0 | 0 | 0 | 0.00 | |
| 8 | over 500 000 | 0 | 0 | 0 | 0 | 0.00 | |
|
|


 Statistical DataLegal ActsElectoral BodiesElection Committees and CandidatesTurnoutResultsSearchDocumentsCreated by