|
|
| . |
. |
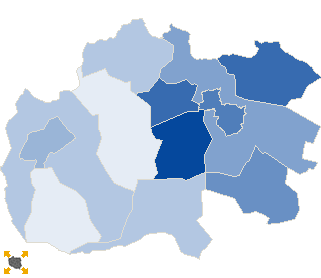
Voting results |
. |
. |
| . |
. |
| . |
. |
. |
. |
. |
. |
. |
. |
. |
. |
. |
. |
| No. |
Name |
No. entitled
to vote |
No. of ballot
papers issued |
No. of |
No. of total votes / No. entitled to vote
[%] |
| total votes |
valid votes |
| 120703 | Dobra, gm. | 7311 | 1575 | 1573 | 1535 | 21.52 |  |
| 120704 | Jodłownik, gm. | 6287 | 1585 | 1584 | 1535 | 25.19 | |
| 120705 | Kamienica, gm. | 5481 | 1363 | 1363 | 1333 | 24.87 | |
| 120706 | Laskowa, gm. | 5565 | 1919 | 1919 | 1895 | 34.48 | |
| 120707 | Limanowa, gm. | 17311 | 4850 | 4850 | 4743 | 28.02 | |
| 120701 | Limanowa, m. | 11992 | 3895 | 3895 | 3851 | 32.48 | |
| 120708 | Łukowica, gm. | 6855 | 2003 | 2002 | 1939 | 29.20 | |
| 120709 | Mszana Dolna, gm. | 12203 | 2917 | 2916 | 2854 | 23.90 | |
| 120702 | Mszana Dolna, m. | 5843 | 1522 | 1522 | 1496 | 26.05 | |
| 120710 | Niedźwiedź, gm. | 5030 | 1002 | 1001 | 978 | 19.90 | |
| 120711 | Słopnice, gm. | 4214 | 1622 | 1622 | 1570 | 38.49 | |
| 120712 | Tymbark, gm. | 4649 | 1551 | 1551 | 1504 | 33.36 | |
| |
limanowski |
92741 |
25804 |
25798 |
25233 |
27.82 |
 |
|
| |
| . |
. |
Turnout by location of ward electoral commission |
. |
. |
| . |
. |
| . |
. |
. |
. |
. |
. |
. |
. |
. |
. |
. |
. |
| No. |
Name |
No. entitled
to vote |
No. of ballot
papers issued |
No. of |
No. of total votes / No. entitled to vote
[%] |
| total votes |
valid votes |
| 1 | City | 17835 | 5417 | 5417 | 5347 | 30.37 | |
| 2 | Country | 74906 | 20387 | 20381 | 19886 | 27.21 | |
| . |
Turnout by number of inhabitants of commune |
. |
| 1 | to 5 000 | 0 | 0 | 0 | 0 | 0.00 | |
| 2 | from 5 001 to 10 000 | 51235 | 14142 | 14137 | 13785 | 27.59 | |
| 3 | from 10 001 to 20 000 | 24195 | 6812 | 6811 | 6705 | 28.15 | |
| 4 | from 20 001 to 50 000 | 17311 | 4850 | 4850 | 4743 | 28.02 | |
| 5 | from 50 001 to 100 000 | 0 | 0 | 0 | 0 | 0.00 | |
| 6 | from 100 001 to 200 000 | 0 | 0 | 0 | 0 | 0.00 | |
| 7 | from 200 001 to 500 000 | 0 | 0 | 0 | 0 | 0.00 | |
| 8 | over 500 000 | 0 | 0 | 0 | 0 | 0.00 | |
|
|


 Statistical DataLegal ActsElectoral BodiesElection Committees and CandidatesTurnoutResultsSearchDocumentsCreated by