|
|
|
|
| |
| . |
. |
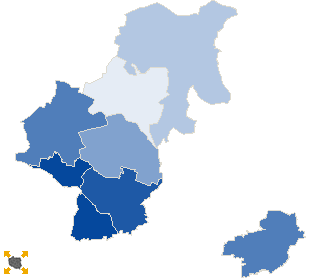
Turnout by location of ward electoral commission |
. |
. |
| . |
. |
| . |
. |
. |
. |
. |
. |
. |
. |
. |
. |
. |
. |
| No. |
Name |
No. entitled
to vote |
No. of ballot
papers issued |
No. of |
No. of total votes / No. entitled to vote
[%] |
| total votes |
valid votes |
| 1 | City | 95976 | 23969 | 23966 | 23525 | 24.97 |  |
| 2 | Country | 30236 | 6007 | 6000 | 5885 | 19.84 | |
| . |
Turnout by number of inhabitants of commune |
. |
| 1 | to 5 000 | 0 | 0 | 0 | 0 | 0.00 | |
| 2 | from 5 001 to 10 000 | 20621 | 4685 | 4683 | 4587 | 22.71 | |
| 3 | from 10 001 to 20 000 | 28851 | 6066 | 6061 | 5946 | 21.01 | |
| 4 | from 20 001 to 50 000 | 28357 | 7261 | 7259 | 7125 | 25.60 | |
| 5 | from 50 001 to 100 000 | 48383 | 11964 | 11963 | 11752 | 24.73 | |
| 6 | from 100 001 to 200 000 | 0 | 0 | 0 | 0 | 0.00 | |
| 7 | from 200 001 to 500 000 | 0 | 0 | 0 | 0 | 0.00 | |
| 8 | over 500 000 | 0 | 0 | 0 | 0 | 0.00 | |
|
|


 Statistical DataLegal ActsElectoral BodiesElection Committees and CandidatesTurnoutResultsSearchDocumentsCreated by