|
|
| . |
. |
Voting results |
. |
. |
| . |
. |
| . |
. |
. |
. |
. |
. |
. |
. |
. |
. |
. |
. |
| No. |
Name |
No. entitled
to vote |
No. of ballot
papers issued |
No. of |
No. of total votes / No. entitled to vote
[%] |
| total votes |
valid votes |
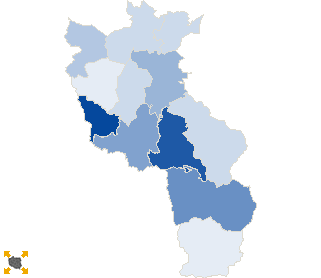
| 240304 | Brenna, gm. | 8151 | 1784 | 1784 | 1741 | 21.89 |  |
| 240305 | Chybie, gm. | 7245 | 1605 | 1605 | 1568 | 22.15 | |
| 240301 | Cieszyn, m. | 29110 | 9828 | 9826 | 9699 | 33.75 | |
| 240306 | Dębowiec, gm. | 4314 | 954 | 954 | 937 | 22.11 | |
| 240307 | Goleszów, gm. | 9997 | 2598 | 2598 | 2549 | 25.99 | |
| 240308 | Hażlach, gm. | 7730 | 1626 | 1626 | 1589 | 21.03 | |
| 240309 | Istebna, gm. | 8735 | 1789 | 1788 | 1732 | 20.47 | |
| 240310 | Skoczów, gm. | 20468 | 5130 | 5129 | 5042 | 25.06 | |
| 240311 | Strumień, gm. | 9549 | 2151 | 2151 | 2104 | 22.53 | |
| 240302 | Ustroń, m. | 13230 | 4181 | 4179 | 4124 | 31.59 | |
| 240303 | Wisła, m. | 9228 | 2575 | 2565 | 2535 | 27.80 | |
| 240312 | Zebrzydowice, gm. | 9912 | 2412 | 2410 | 2368 | 24.31 | |
| |
cieszyński |
137669 |
36633 |
36615 |
35988 |
26.60 |
 |
|
| |
| . |
. |
Turnout by location of ward electoral commission |
. |
. |
| . |
. |
| . |
. |
. |
. |
. |
. |
. |
. |
. |
. |
. |
. |
| No. |
Name |
No. entitled
to vote |
No. of ballot
papers issued |
No. of |
No. of total votes / No. entitled to vote
[%] |
| total votes |
valid votes |
| 1 | City | 66089 | 20543 | 20529 | 20228 | 31.06 | |
| 2 | Country | 71580 | 16090 | 16086 | 15760 | 22.47 | |
| . |
Turnout by number of inhabitants of commune |
. |
| 1 | to 5 000 | 0 | 0 | 0 | 0 | 0.00 | |
| 2 | from 5 001 to 10 000 | 11559 | 2559 | 2559 | 2505 | 22.14 | |
| 3 | from 10 001 to 20 000 | 76532 | 19116 | 19101 | 18742 | 24.96 | |
| 4 | from 20 001 to 50 000 | 49578 | 14958 | 14955 | 14741 | 30.16 | |
| 5 | from 50 001 to 100 000 | 0 | 0 | 0 | 0 | 0.00 | |
| 6 | from 100 001 to 200 000 | 0 | 0 | 0 | 0 | 0.00 | |
| 7 | from 200 001 to 500 000 | 0 | 0 | 0 | 0 | 0.00 | |
| 8 | over 500 000 | 0 | 0 | 0 | 0 | 0.00 | |
|
|


 Statistical DataLegal ActsElectoral BodiesElection Committees and CandidatesTurnoutResultsSearchDocumentsCreated by