|
|
|
|
| |
| . |
. |
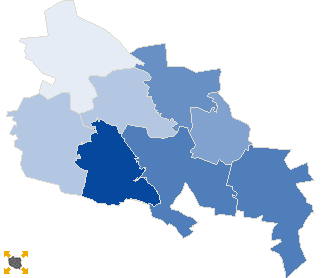
Turnout by location of ward electoral commission |
. |
. |
| . |
. |
| . |
. |
. |
. |
. |
. |
. |
. |
. |
. |
. |
. |
| No. |
Name |
No. entitled
to vote |
No. of ballot
papers issued |
No. of |
No. of total votes / No. entitled to vote
[%] |
| total votes |
valid votes |
| 1 | City | 22823 | 5822 | 5814 | 5699 | 25.47 |  |
| 2 | Country | 39364 | 7439 | 7433 | 7219 | 18.88 | |
| . |
Turnout by number of inhabitants of commune |
. |
| 1 | to 5 000 | 2653 | 512 | 512 | 502 | 19.30 | |
| 2 | from 5 001 to 10 000 | 31025 | 5646 | 5643 | 5481 | 18.19 | |
| 3 | from 10 001 to 20 000 | 9269 | 2051 | 2048 | 1994 | 22.10 | |
| 4 | from 20 001 to 50 000 | 19240 | 5052 | 5044 | 4941 | 26.22 | |
| 5 | from 50 001 to 100 000 | 0 | 0 | 0 | 0 | 0.00 | |
| 6 | from 100 001 to 200 000 | 0 | 0 | 0 | 0 | 0.00 | |
| 7 | from 200 001 to 500 000 | 0 | 0 | 0 | 0 | 0.00 | |
| 8 | over 500 000 | 0 | 0 | 0 | 0 | 0.00 | |
|
|


 Statistical DataLegal ActsElectoral BodiesElection Committees and CandidatesTurnoutResultsSearchDocumentsCreated by