|
|
|
|
| |
| . |
. |
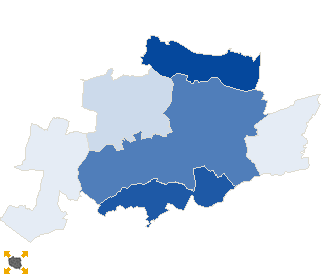
Turnout by location of ward electoral commission |
. |
. |
| . |
. |
| . |
. |
. |
. |
. |
. |
. |
. |
. |
. |
. |
. |
| No. |
Name |
No. entitled
to vote |
No. of ballot
papers issued |
No. of |
No. of total votes / No. entitled to vote
[%] |
| total votes |
valid votes |
| 1 | City | 21266 | 6266 | 6257 | 6187 | 29.42 |  |
| 2 | Country | 61742 | 14890 | 14878 | 14642 | 24.10 | |
| . |
Turnout by number of inhabitants of commune |
. |
| 1 | to 5 000 | 3747 | 1117 | 1117 | 1100 | 29.81 | |
| 2 | from 5 001 to 10 000 | 5084 | 1472 | 1472 | 1454 | 28.95 | |
| 3 | from 10 001 to 20 000 | 34260 | 7740 | 7736 | 7594 | 22.58 | |
| 4 | from 20 001 to 50 000 | 0 | 0 | 0 | 0 | 0.00 | |
| 5 | from 50 001 to 100 000 | 39917 | 10827 | 10810 | 10681 | 27.08 | |
| 6 | from 100 001 to 200 000 | 0 | 0 | 0 | 0 | 0.00 | |
| 7 | from 200 001 to 500 000 | 0 | 0 | 0 | 0 | 0.00 | |
| 8 | over 500 000 | 0 | 0 | 0 | 0 | 0.00 | |
|
|


 Statistical DataLegal ActsElectoral BodiesElection Committees and CandidatesTurnoutResultsSearchDocumentsCreated by