|
|
|
|
| |
| . |
. |
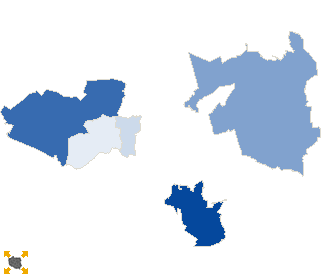
Turnout by location of ward electoral commission |
. |
. |
| . |
. |
| . |
. |
. |
. |
. |
. |
. |
. |
. |
. |
. |
. |
| No. |
Name |
No. entitled
to vote |
No. of ballot
papers issued |
No. of |
No. of total votes / No. entitled to vote
[%] |
| total votes |
valid votes |
| 1 | City | 22683 | 4675 | 4674 | 4574 | 20.61 |  |
| 2 | Country | 36629 | 7688 | 7685 | 7499 | 20.98 | |
| . |
Turnout by number of inhabitants of commune |
. |
| 1 | to 5 000 | 3009 | 581 | 581 | 565 | 19.31 | |
| 2 | from 5 001 to 10 000 | 14551 | 2936 | 2935 | 2859 | 20.17 | |
| 3 | from 10 001 to 20 000 | 8858 | 2044 | 2043 | 1993 | 23.06 | |
| 4 | from 20 001 to 50 000 | 32894 | 6802 | 6800 | 6656 | 20.67 | |
| 5 | from 50 001 to 100 000 | 0 | 0 | 0 | 0 | 0.00 | |
| 6 | from 100 001 to 200 000 | 0 | 0 | 0 | 0 | 0.00 | |
| 7 | from 200 001 to 500 000 | 0 | 0 | 0 | 0 | 0.00 | |
| 8 | over 500 000 | 0 | 0 | 0 | 0 | 0.00 | |
|
|


 Statistical DataLegal ActsElectoral BodiesElection Committees and CandidatesTurnoutResultsSearchDocumentsCreated by