|
|
|
|
| |
| . |
. |
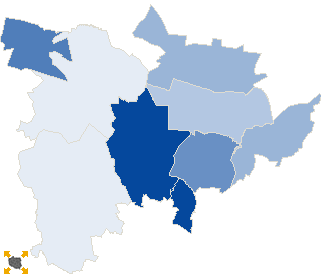
Turnout by location of ward electoral commission |
. |
. |
| . |
. |
| . |
. |
. |
. |
. |
. |
. |
. |
. |
. |
. |
. |
| No. |
Name |
No. entitled
to vote |
No. of ballot
papers issued |
No. of |
No. of total votes / No. entitled to vote
[%] |
| total votes |
valid votes |
| 1 | City | 77511 | 21154 | 21128 | 20795 | 27.26 |  |
| 2 | Country | 35211 | 7113 | 7096 | 6978 | 20.15 | |
| . |
Turnout by number of inhabitants of commune |
. |
| 1 | to 5 000 | 2755 | 670 | 670 | 660 | 24.32 | |
| 2 | from 5 001 to 10 000 | 24029 | 4817 | 4809 | 4731 | 20.01 | |
| 3 | from 10 001 to 20 000 | 35355 | 8251 | 8238 | 8108 | 23.30 | |
| 4 | from 20 001 to 50 000 | 0 | 0 | 0 | 0 | 0.00 | |
| 5 | from 50 001 to 100 000 | 50583 | 14529 | 14507 | 14274 | 28.68 | |
| 6 | from 100 001 to 200 000 | 0 | 0 | 0 | 0 | 0.00 | |
| 7 | from 200 001 to 500 000 | 0 | 0 | 0 | 0 | 0.00 | |
| 8 | over 500 000 | 0 | 0 | 0 | 0 | 0.00 | |
|
|


 Statistical DataLegal ActsElectoral BodiesElection Committees and CandidatesTurnoutResultsSearchDocumentsCreated by