|
|
| . |
. |
Voting results |
. |
. |
| . |
. |
| . |
. |
. |
. |
. |
. |
. |
. |
. |
. |
. |
. |
| No. |
Name |
No. entitled
to vote |
No. of ballot
papers issued |
No. of |
No. of total votes / No. entitled to vote
[%] |
| total votes |
valid votes |
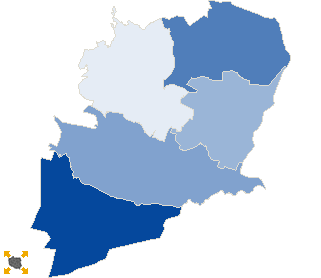
| 241401 | Bieruń, m. | 15734 | 3851 | 3851 | 3792 | 24.48 |  |
| 241404 | Bojszowy, gm. | 5399 | 1645 | 1645 | 1614 | 30.47 | |
| 241405 | Chełm Śląski, gm. | 4633 | 1126 | 1126 | 1110 | 24.30 | |
| 241402 | Imielin, m. | 6417 | 1717 | 1717 | 1689 | 26.76 | |
| 241403 | Lędziny, m. | 12823 | 2604 | 2603 | 2538 | 20.30 | |
| |
bieruńsko-lędziński |
45006 |
10943 |
10942 |
10743 |
24.31 |
 |
|
| |
| . |
. |
Turnout by location of ward electoral commission |
. |
. |
| . |
. |
| . |
. |
. |
. |
. |
. |
. |
. |
. |
. |
. |
. |
| No. |
Name |
No. entitled
to vote |
No. of ballot
papers issued |
No. of |
No. of total votes / No. entitled to vote
[%] |
| total votes |
valid votes |
| 1 | City | 34974 | 8172 | 8171 | 8019 | 23.36 | |
| 2 | Country | 10032 | 2771 | 2771 | 2724 | 27.62 | |
| . |
Turnout by number of inhabitants of commune |
. |
| 1 | to 5 000 | 0 | 0 | 0 | 0 | 0.00 | |
| 2 | from 5 001 to 10 000 | 16449 | 4488 | 4488 | 4413 | 27.28 | |
| 3 | from 10 001 to 20 000 | 28557 | 6455 | 6454 | 6330 | 22.60 | |
| 4 | from 20 001 to 50 000 | 0 | 0 | 0 | 0 | 0.00 | |
| 5 | from 50 001 to 100 000 | 0 | 0 | 0 | 0 | 0.00 | |
| 6 | from 100 001 to 200 000 | 0 | 0 | 0 | 0 | 0.00 | |
| 7 | from 200 001 to 500 000 | 0 | 0 | 0 | 0 | 0.00 | |
| 8 | over 500 000 | 0 | 0 | 0 | 0 | 0.00 | |
|
|


 Statistical DataLegal ActsElectoral BodiesElection Committees and CandidatesTurnoutResultsSearchDocumentsCreated by