|
|
|
|
| |
| . |
. |
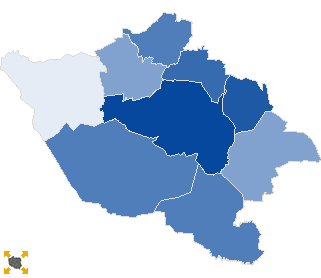
Turnout by location of ward electoral commission |
. |
. |
| . |
. |
| . |
. |
. |
. |
. |
. |
. |
. |
. |
. |
. |
. |
| No. |
Name |
No. entitled
to vote |
No. of ballot
papers issued |
No. of |
No. of total votes / No. entitled to vote
[%] |
| total votes |
valid votes |
| 1 | City | 83238 | 18648 | 18627 | 18319 | 22.38 |  |
| 2 | Country | 42554 | 8472 | 8467 | 8304 | 19.90 | |
| . |
Turnout by number of inhabitants of commune |
. |
| 1 | to 5 000 | 0 | 0 | 0 | 0 | 0.00 | |
| 2 | from 5 001 to 10 000 | 16303 | 2957 | 2954 | 2901 | 18.12 | |
| 3 | from 10 001 to 20 000 | 52092 | 10845 | 10840 | 10651 | 20.81 | |
| 4 | from 20 001 to 50 000 | 57397 | 13318 | 13300 | 13071 | 23.17 | |
| 5 | from 50 001 to 100 000 | 0 | 0 | 0 | 0 | 0.00 | |
| 6 | from 100 001 to 200 000 | 0 | 0 | 0 | 0 | 0.00 | |
| 7 | from 200 001 to 500 000 | 0 | 0 | 0 | 0 | 0.00 | |
| 8 | over 500 000 | 0 | 0 | 0 | 0 | 0.00 | |
|
|


 Statistical DataLegal ActsElectoral BodiesElection Committees and CandidatesTurnoutResultsSearchDocumentsCreated by