|
|
| . |
. |
Voting results |
. |
. |
| . |
. |
| . |
. |
. |
. |
. |
. |
. |
. |
. |
. |
. |
. |
| No. |
Name |
No. entitled
to vote |
No. of ballot
papers issued |
No. of |
No. of total votes / No. entitled to vote
[%] |
| total votes |
valid votes |
| 241603 | Irządze, gm. | 2298 | 314 | 314 | 303 | 13.66 |  |
| 241604 | Kroczyce, gm. | 4998 | 696 | 696 | 675 | 13.93 | |
| 241605 | Łazy, gm. | 13327 | 2736 | 2736 | 2674 | 20.53 | |
| 241606 | Ogrodzieniec, gm. | 7930 | 1476 | 1476 | 1453 | 18.61 | |
| 241607 | Pilica, gm. | 7477 | 1273 | 1273 | 1249 | 17.03 | |
| 241601 | Poręba, m. | 7329 | 1469 | 1467 | 1436 | 20.02 | |
| 241608 | Szczekociny, gm. | 6939 | 1222 | 1216 | 1197 | 17.52 | |
| 241609 | Włodowice, gm. | 4346 | 606 | 606 | 589 | 13.94 | |
| 241602 | Zawiercie, m. | 44298 | 9829 | 9821 | 9645 | 22.17 | |
| 241610 | Żarnowiec, gm. | 3883 | 660 | 660 | 640 | 17.00 | |
| |
zawierciański |
102825 |
20281 |
20265 |
19861 |
19.71 |
 |
|
| |
| . |
. |
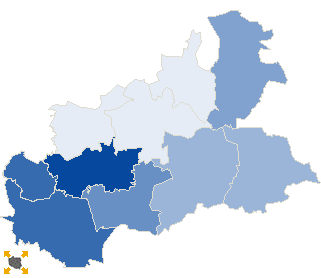
Turnout by location of ward electoral commission |
. |
. |
| . |
. |
| . |
. |
. |
. |
. |
. |
. |
. |
. |
. |
. |
. |
| No. |
Name |
No. entitled
to vote |
No. of ballot
papers issued |
No. of |
No. of total votes / No. entitled to vote
[%] |
| total votes |
valid votes |
| 1 | City | 68379 | 14903 | 14887 | 14622 | 21.77 | |
| 2 | Country | 34446 | 5378 | 5378 | 5239 | 15.61 | |
| . |
Turnout by number of inhabitants of commune |
. |
| 1 | to 5 000 | 6181 | 974 | 974 | 943 | 15.76 | |
| 2 | from 5 001 to 10 000 | 39019 | 6742 | 6734 | 6599 | 17.26 | |
| 3 | from 10 001 to 20 000 | 13327 | 2736 | 2736 | 2674 | 20.53 | |
| 4 | from 20 001 to 50 000 | 0 | 0 | 0 | 0 | 0.00 | |
| 5 | from 50 001 to 100 000 | 44298 | 9829 | 9821 | 9645 | 22.17 | |
| 6 | from 100 001 to 200 000 | 0 | 0 | 0 | 0 | 0.00 | |
| 7 | from 200 001 to 500 000 | 0 | 0 | 0 | 0 | 0.00 | |
| 8 | over 500 000 | 0 | 0 | 0 | 0 | 0.00 | |
|
|


 Statistical DataLegal ActsElectoral BodiesElection Committees and CandidatesTurnoutResultsSearchDocumentsCreated by