|
|
|
|
| |
| . |
. |
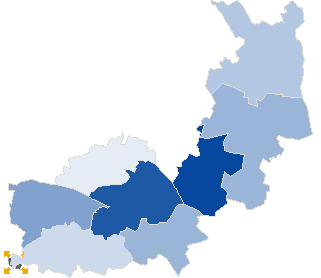
Turnout by location of ward electoral commission |
. |
. |
| . |
. |
| . |
. |
. |
. |
. |
. |
. |
. |
. |
. |
. |
. |
| No. |
Name |
No. entitled
to vote |
No. of ballot
papers issued |
No. of |
No. of total votes / No. entitled to vote
[%] |
| total votes |
valid votes |
| 1 | City | 11579 | 2028 | 2025 | 1947 | 17.49 |  |
| 2 | Country | 34268 | 5000 | 4986 | 4801 | 14.55 | |
| . |
Turnout by number of inhabitants of commune |
. |
| 1 | to 5 000 | 7043 | 1102 | 1094 | 1050 | 15.53 | |
| 2 | from 5 001 to 10 000 | 19204 | 2684 | 2678 | 2608 | 13.95 | |
| 3 | from 10 001 to 20 000 | 19600 | 3242 | 3239 | 3090 | 16.53 | |
| 4 | from 20 001 to 50 000 | 0 | 0 | 0 | 0 | 0.00 | |
| 5 | from 50 001 to 100 000 | 0 | 0 | 0 | 0 | 0.00 | |
| 6 | from 100 001 to 200 000 | 0 | 0 | 0 | 0 | 0.00 | |
| 7 | from 200 001 to 500 000 | 0 | 0 | 0 | 0 | 0.00 | |
| 8 | over 500 000 | 0 | 0 | 0 | 0 | 0.00 | |
|
|


 Statistical DataLegal ActsElectoral BodiesElection Committees and CandidatesTurnoutResultsSearchDocumentsCreated by