|
|
| . |
. |
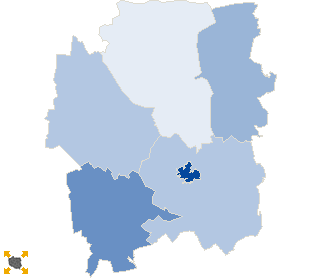
Voting results |
. |
. |
| . |
. |
| . |
. |
. |
. |
. |
. |
. |
. |
. |
. |
. |
. |
| No. |
Name |
No. entitled
to vote |
No. of ballot
papers issued |
No. of |
No. of total votes / No. entitled to vote
[%] |
| total votes |
valid votes |
| 280802 | Barciany, gm. | 5492 | 503 | 503 | 486 | 9.16 |  |
| 280803 | Kętrzyn, gm. | 6481 | 810 | 804 | 790 | 12.41 | |
| 280801 | Kętrzyn, m. | 23732 | 4895 | 4895 | 4809 | 20.63 | |
| 280804 | Korsze, gm. | 8850 | 1077 | 1077 | 1058 | 12.17 | |
| 280805 | Reszel, gm. | 6951 | 1036 | 1036 | 1016 | 14.90 | |
| 280806 | Srokowo, gm. | 3412 | 464 | 455 | 450 | 13.34 | |
| |
kętrzyński |
54918 |
8785 |
8770 |
8609 |
15.97 |
 |
|
| |
| . |
. |
Turnout by location of ward electoral commission |
. |
. |
| . |
. |
| . |
. |
. |
. |
. |
. |
. |
. |
. |
. |
. |
. |
| No. |
Name |
No. entitled
to vote |
No. of ballot
papers issued |
No. of |
No. of total votes / No. entitled to vote
[%] |
| total votes |
valid votes |
| 1 | City | 31941 | 6290 | 6290 | 6179 | 19.69 | |
| 2 | Country | 22977 | 2495 | 2480 | 2430 | 10.79 | |
| . |
Turnout by number of inhabitants of commune |
. |
| 1 | to 5 000 | 3412 | 464 | 455 | 450 | 13.34 | |
| 2 | from 5 001 to 10 000 | 18924 | 2349 | 2343 | 2292 | 12.38 | |
| 3 | from 10 001 to 20 000 | 8850 | 1077 | 1077 | 1058 | 12.17 | |
| 4 | from 20 001 to 50 000 | 23732 | 4895 | 4895 | 4809 | 20.63 | |
| 5 | from 50 001 to 100 000 | 0 | 0 | 0 | 0 | 0.00 | |
| 6 | from 100 001 to 200 000 | 0 | 0 | 0 | 0 | 0.00 | |
| 7 | from 200 001 to 500 000 | 0 | 0 | 0 | 0 | 0.00 | |
| 8 | over 500 000 | 0 | 0 | 0 | 0 | 0.00 | |
|
|


 Statistical DataLegal ActsElectoral BodiesElection Committees and CandidatesTurnoutResultsSearchDocumentsCreated by