|
|
|
|
| |
| . |
. |
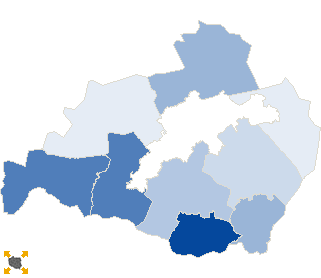
Turnout by location of ward electoral commission |
. |
. |
| . |
. |
| . |
. |
. |
. |
. |
. |
. |
. |
. |
. |
. |
. |
| No. |
Name |
No. entitled
to vote |
No. of ballot
papers issued |
No. of |
No. of total votes / No. entitled to vote
[%] |
| total votes |
valid votes |
| 1 | City | 25354 | 5525 | 5522 | 5384 | 21.78 |  |
| 2 | Country | 27443 | 5244 | 5243 | 5098 | 19.11 | |
| . |
Turnout by number of inhabitants of commune |
. |
| 1 | to 5 000 | 7794 | 1700 | 1697 | 1646 | 21.77 | |
| 2 | from 5 001 to 10 000 | 27201 | 5615 | 5615 | 5488 | 20.64 | |
| 3 | from 10 001 to 20 000 | 17802 | 3454 | 3453 | 3348 | 19.40 | |
| 4 | from 20 001 to 50 000 | 0 | 0 | 0 | 0 | 0.00 | |
| 5 | from 50 001 to 100 000 | 0 | 0 | 0 | 0 | 0.00 | |
| 6 | from 100 001 to 200 000 | 0 | 0 | 0 | 0 | 0.00 | |
| 7 | from 200 001 to 500 000 | 0 | 0 | 0 | 0 | 0.00 | |
| 8 | over 500 000 | 0 | 0 | 0 | 0 | 0.00 | |
|
|


 Statistical DataLegal ActsElectoral BodiesElection Committees and CandidatesTurnoutResultsSearchDocumentsCreated by