|
|
|
|
| |
| . |
. |
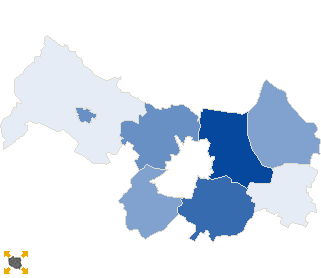
Turnout by location of ward electoral commission |
. |
. |
| . |
. |
| . |
. |
. |
. |
. |
. |
. |
. |
. |
. |
. |
. |
| No. |
Name |
No. entitled
to vote |
No. of ballot
papers issued |
No. of |
No. of total votes / No. entitled to vote
[%] |
| total votes |
valid votes |
| 1 | City | 15068 | 2904 | 2904 | 2852 | 19.27 |  |
| 2 | Country | 27728 | 4898 | 4896 | 4741 | 17.66 | |
| . |
Turnout by number of inhabitants of commune |
. |
| 1 | to 5 000 | 8414 | 1537 | 1537 | 1480 | 18.27 | |
| 2 | from 5 001 to 10 000 | 22638 | 4079 | 4077 | 3971 | 18.01 | |
| 3 | from 10 001 to 20 000 | 11744 | 2186 | 2186 | 2142 | 18.61 | |
| 4 | from 20 001 to 50 000 | 0 | 0 | 0 | 0 | 0.00 | |
| 5 | from 50 001 to 100 000 | 0 | 0 | 0 | 0 | 0.00 | |
| 6 | from 100 001 to 200 000 | 0 | 0 | 0 | 0 | 0.00 | |
| 7 | from 200 001 to 500 000 | 0 | 0 | 0 | 0 | 0.00 | |
| 8 | over 500 000 | 0 | 0 | 0 | 0 | 0.00 | |
|
|


 Statistical DataLegal ActsElectoral BodiesElection Committees and CandidatesTurnoutResultsSearchDocumentsCreated by