|
|
| . |
. |
Voting results |
. |
. |
| . |
. |
| . |
. |
. |
. |
. |
. |
. |
. |
. |
. |
. |
. |
| No. |
Name |
No. entitled
to vote |
No. of ballot
papers issued |
No. of |
No. of total votes / No. entitled to vote
[%] |
| total votes |
valid votes |
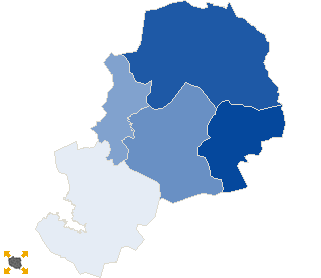
| 021201 | Gryfów Śląski, gm. | 8391 | 1476 | 1475 | 1427 | 17.58 |  |
| 021202 | Lubomierz, gm. | 4940 | 879 | 879 | 854 | 17.79 | |
| 021203 | Lwówek Śląski, gm. | 14323 | 2669 | 2668 | 2589 | 18.63 | |
| 021204 | Mirsk, gm. | 7305 | 1181 | 1181 | 1154 | 16.17 | |
| 021205 | Wleń, gm. | 3737 | 712 | 712 | 691 | 19.05 | |
| |
lwówecki |
38696 |
6917 |
6915 |
6715 |
17.87 |
 |
|
| |
| . |
. |
Turnout by location of ward electoral commission |
. |
. |
| . |
. |
| . |
. |
. |
. |
. |
. |
. |
. |
. |
. |
. |
. |
| No. |
Name |
No. entitled
to vote |
No. of ballot
papers issued |
No. of |
No. of total votes / No. entitled to vote
[%] |
| total votes |
valid votes |
| 1 | City | 21702 | 4470 | 4468 | 4348 | 20.59 | |
| 2 | Country | 16994 | 2447 | 2447 | 2367 | 14.40 | |
| . |
Turnout by number of inhabitants of commune |
. |
| 1 | to 5 000 | 3737 | 712 | 712 | 691 | 19.05 | |
| 2 | from 5 001 to 10 000 | 12245 | 2060 | 2060 | 2008 | 16.82 | |
| 3 | from 10 001 to 20 000 | 22714 | 4145 | 4143 | 4016 | 18.24 | |
| 4 | from 20 001 to 50 000 | 0 | 0 | 0 | 0 | 0.00 | |
| 5 | from 50 001 to 100 000 | 0 | 0 | 0 | 0 | 0.00 | |
| 6 | from 100 001 to 200 000 | 0 | 0 | 0 | 0 | 0.00 | |
| 7 | from 200 001 to 500 000 | 0 | 0 | 0 | 0 | 0.00 | |
| 8 | over 500 000 | 0 | 0 | 0 | 0 | 0.00 | |
|
|


 Statistical DataLegal ActsElectoral BodiesElection Committees and CandidatesTurnoutResultsSearchDocumentsCreated by