|
|
|
|
| |
| . |
. |
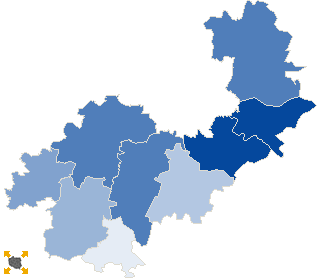
Turnout by location of ward electoral commission |
. |
. |
| . |
. |
| . |
. |
. |
. |
. |
. |
. |
. |
. |
. |
. |
. |
| No. |
Name |
No. entitled
to vote |
No. of ballot
papers issued |
No. of |
No. of total votes / No. entitled to vote
[%] |
| total votes |
valid votes |
| 1 | City | 15745 | 3619 | 3617 | 3563 | 22.97 |  |
| 2 | Country | 69264 | 16012 | 16004 | 15744 | 23.11 | |
| . |
Turnout by number of inhabitants of commune |
. |
| 1 | to 5 000 | 5543 | 981 | 981 | 956 | 17.70 | |
| 2 | from 5 001 to 10 000 | 14435 | 3350 | 3350 | 3290 | 23.21 | |
| 3 | from 10 001 to 20 000 | 48271 | 11334 | 11329 | 11146 | 23.47 | |
| 4 | from 20 001 to 50 000 | 16760 | 3966 | 3961 | 3915 | 23.63 | |
| 5 | from 50 001 to 100 000 | 0 | 0 | 0 | 0 | 0.00 | |
| 6 | from 100 001 to 200 000 | 0 | 0 | 0 | 0 | 0.00 | |
| 7 | from 200 001 to 500 000 | 0 | 0 | 0 | 0 | 0.00 | |
| 8 | over 500 000 | 0 | 0 | 0 | 0 | 0.00 | |
|
|


 Statistical DataLegal ActsElectoral BodiesElection Committees and CandidatesTurnoutResultsSearchDocumentsCreated by