|
|
|
|
| |
| . |
. |
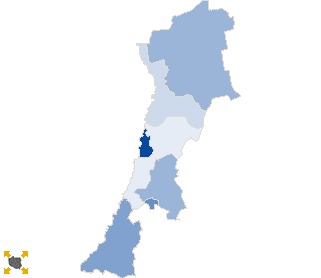
Turnout by location of ward electoral commission |
. |
. |
| . |
. |
| . |
. |
. |
. |
. |
. |
. |
. |
. |
. |
. |
. |
| No. |
Name |
No. entitled
to vote |
No. of ballot
papers issued |
No. of |
No. of total votes / No. entitled to vote
[%] |
| total votes |
valid votes |
| 1 | City | 53559 | 11412 | 11401 | 11139 | 21.29 |  |
| 2 | Country | 23373 | 3693 | 3693 | 3550 | 15.80 | |
| . |
Turnout by number of inhabitants of commune |
. |
| 1 | to 5 000 | 3574 | 704 | 704 | 682 | 19.70 | |
| 2 | from 5 001 to 10 000 | 25844 | 4183 | 4176 | 4020 | 16.16 | |
| 3 | from 10 001 to 20 000 | 0 | 0 | 0 | 0 | 0.00 | |
| 4 | from 20 001 to 50 000 | 47514 | 10218 | 10214 | 9987 | 21.50 | |
| 5 | from 50 001 to 100 000 | 0 | 0 | 0 | 0 | 0.00 | |
| 6 | from 100 001 to 200 000 | 0 | 0 | 0 | 0 | 0.00 | |
| 7 | from 200 001 to 500 000 | 0 | 0 | 0 | 0 | 0.00 | |
| 8 | over 500 000 | 0 | 0 | 0 | 0 | 0.00 | |
|
|


 Statistical DataLegal ActsElectoral BodiesElection Committees and CandidatesTurnoutResultsSearchDocumentsCreated by