|
|
|
|
| |
| . |
. |
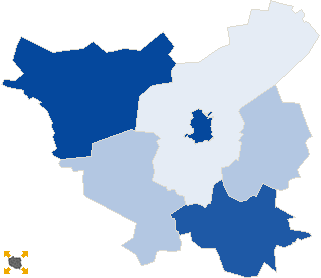
Turnout by location of ward electoral commission |
. |
. |
| . |
. |
| . |
. |
. |
. |
. |
. |
. |
. |
. |
. |
. |
. |
| No. |
Name |
No. entitled
to vote |
No. of ballot
papers issued |
No. of |
No. of total votes / No. entitled to vote
[%] |
| total votes |
valid votes |
| 1 | City | 14228 | 3116 | 3114 | 3013 | 21.89 |  |
| 2 | Country | 20898 | 3441 | 3441 | 3343 | 16.47 | |
| . |
Turnout by number of inhabitants of commune |
. |
| 1 | to 5 000 | 9702 | 1692 | 1692 | 1642 | 17.44 | |
| 2 | from 5 001 to 10 000 | 6455 | 944 | 944 | 914 | 14.62 | |
| 3 | from 10 001 to 20 000 | 18969 | 3921 | 3919 | 3800 | 20.66 | |
| 4 | from 20 001 to 50 000 | 0 | 0 | 0 | 0 | 0.00 | |
| 5 | from 50 001 to 100 000 | 0 | 0 | 0 | 0 | 0.00 | |
| 6 | from 100 001 to 200 000 | 0 | 0 | 0 | 0 | 0.00 | |
| 7 | from 200 001 to 500 000 | 0 | 0 | 0 | 0 | 0.00 | |
| 8 | over 500 000 | 0 | 0 | 0 | 0 | 0.00 | |
|
|


 Statistical DataLegal ActsElectoral BodiesElection Committees and CandidatesTurnoutResultsSearchDocumentsCreated by