|
|
|
|
| |
| . |
. |
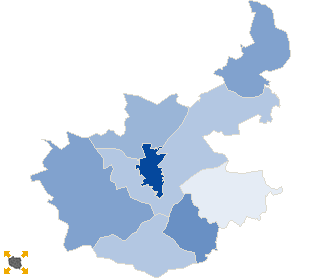
Turnout by location of ward electoral commission |
. |
. |
| . |
. |
| . |
. |
. |
. |
. |
. |
. |
. |
. |
. |
. |
. |
| No. |
Name |
No. entitled
to vote |
No. of ballot
papers issued |
No. of |
No. of total votes / No. entitled to vote
[%] |
| total votes |
valid votes |
| 1 | City | 48966 | 9956 | 9941 | 9773 | 20.30 |  |
| 2 | Country | 20790 | 2973 | 2972 | 2884 | 14.30 | |
| . |
Turnout by number of inhabitants of commune |
. |
| 1 | to 5 000 | 5265 | 753 | 753 | 717 | 14.30 | |
| 2 | from 5 001 to 10 000 | 18711 | 2923 | 2922 | 2850 | 15.62 | |
| 3 | from 10 001 to 20 000 | 12771 | 2065 | 2065 | 2021 | 16.17 | |
| 4 | from 20 001 to 50 000 | 33009 | 7188 | 7173 | 7069 | 21.73 | |
| 5 | from 50 001 to 100 000 | 0 | 0 | 0 | 0 | 0.00 | |
| 6 | from 100 001 to 200 000 | 0 | 0 | 0 | 0 | 0.00 | |
| 7 | from 200 001 to 500 000 | 0 | 0 | 0 | 0 | 0.00 | |
| 8 | over 500 000 | 0 | 0 | 0 | 0 | 0.00 | |
|
|


 Statistical DataLegal ActsElectoral BodiesElection Committees and CandidatesTurnoutResultsSearchDocumentsCreated by