|
|
| . |
. |
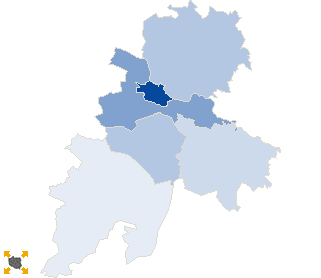
Voting results |
. |
. |
| . |
. |
| . |
. |
. |
. |
. |
. |
. |
. |
. |
. |
. |
. |
| No. |
Name |
No. entitled
to vote |
No. of ballot
papers issued |
No. of |
No. of total votes / No. entitled to vote
[%] |
| total votes |
valid votes |
| 160101 | Brzeg, m. | 30929 | 7936 | 7933 | 7814 | 25.65 |  |
| 160103 | Grodków, gm. | 15854 | 2600 | 2599 | 2541 | 16.39 | |
| 160104 | Lewin Brzeski, gm. | 10578 | 1867 | 1866 | 1829 | 17.64 | |
| 160105 | Lubsza, gm. | 7156 | 1308 | 1308 | 1278 | 18.28 | |
| 160106 | Olszanka, gm. | 3933 | 720 | 720 | 696 | 18.31 | |
| 160102 | Skarbimierz, gm. | 5468 | 1109 | 1107 | 1073 | 20.25 | |
| |
brzeski |
73918 |
15540 |
15533 |
15231 |
21.01 |
 |
|
| |
| . |
. |
Turnout by location of ward electoral commission |
. |
. |
| . |
. |
| . |
. |
. |
. |
. |
. |
. |
. |
. |
. |
. |
. |
| No. |
Name |
No. entitled
to vote |
No. of ballot
papers issued |
No. of |
No. of total votes / No. entitled to vote
[%] |
| total votes |
valid votes |
| 1 | City | 44618 | 10747 | 10743 | 10570 | 24.08 | |
| 2 | Country | 29300 | 4793 | 4790 | 4661 | 16.35 | |
| . |
Turnout by number of inhabitants of commune |
. |
| 1 | to 5 000 | 3933 | 720 | 720 | 696 | 18.31 | |
| 2 | from 5 001 to 10 000 | 12624 | 2417 | 2415 | 2351 | 19.13 | |
| 3 | from 10 001 to 20 000 | 26432 | 4467 | 4465 | 4370 | 16.89 | |
| 4 | from 20 001 to 50 000 | 30929 | 7936 | 7933 | 7814 | 25.65 | |
| 5 | from 50 001 to 100 000 | 0 | 0 | 0 | 0 | 0.00 | |
| 6 | from 100 001 to 200 000 | 0 | 0 | 0 | 0 | 0.00 | |
| 7 | from 200 001 to 500 000 | 0 | 0 | 0 | 0 | 0.00 | |
| 8 | over 500 000 | 0 | 0 | 0 | 0 | 0.00 | |
|
|


 Statistical DataLegal ActsElectoral BodiesElection Committees and CandidatesTurnoutResultsSearchDocumentsCreated by