|
|
| . |
. |
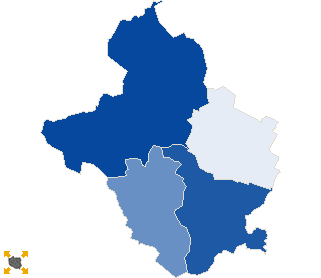
Voting results |
. |
. |
| . |
. |
| . |
. |
. |
. |
. |
. |
. |
. |
. |
. |
. |
. |
| No. |
Name |
No. entitled
to vote |
No. of ballot
papers issued |
No. of |
No. of total votes / No. entitled to vote
[%] |
| total votes |
valid votes |
| 160201 | Baborów, gm. | 5273 | 583 | 582 | 559 | 11.04 |  |
| 160202 | Branice, gm. | 6043 | 934 | 931 | 908 | 15.41 | |
| 160203 | Głubczyce, gm. | 19359 | 3629 | 3624 | 3548 | 18.72 | |
| 160204 | Kietrz, gm. | 9305 | 1671 | 1671 | 1607 | 17.96 | |
| |
głubczycki |
39980 |
6817 |
6808 |
6622 |
17.03 |
 |
|
| |
| . |
. |
Turnout by location of ward electoral commission |
. |
. |
| . |
. |
| . |
. |
. |
. |
. |
. |
. |
. |
. |
. |
. |
. |
| No. |
Name |
No. entitled
to vote |
No. of ballot
papers issued |
No. of |
No. of total votes / No. entitled to vote
[%] |
| total votes |
valid votes |
| 1 | City | 19581 | 3879 | 3877 | 3773 | 19.80 | |
| 2 | Country | 20399 | 2938 | 2931 | 2849 | 14.37 | |
| . |
Turnout by number of inhabitants of commune |
. |
| 1 | to 5 000 | 0 | 0 | 0 | 0 | 0.00 | |
| 2 | from 5 001 to 10 000 | 11316 | 1517 | 1513 | 1467 | 13.37 | |
| 3 | from 10 001 to 20 000 | 9305 | 1671 | 1671 | 1607 | 17.96 | |
| 4 | from 20 001 to 50 000 | 19359 | 3629 | 3624 | 3548 | 18.72 | |
| 5 | from 50 001 to 100 000 | 0 | 0 | 0 | 0 | 0.00 | |
| 6 | from 100 001 to 200 000 | 0 | 0 | 0 | 0 | 0.00 | |
| 7 | from 200 001 to 500 000 | 0 | 0 | 0 | 0 | 0.00 | |
| 8 | over 500 000 | 0 | 0 | 0 | 0 | 0.00 | |
|
|


 Statistical DataLegal ActsElectoral BodiesElection Committees and CandidatesTurnoutResultsSearchDocumentsCreated by