|
|
| . |
. |
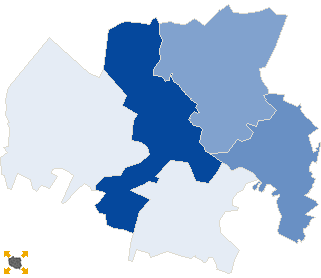
Voting results |
. |
. |
| . |
. |
| . |
. |
. |
. |
. |
. |
. |
. |
. |
. |
. |
. |
| No. |
Name |
No. entitled
to vote |
No. of ballot
papers issued |
No. of |
No. of total votes / No. entitled to vote
[%] |
| total votes |
valid votes |
| 160501 | Gogolin, gm. | 10310 | 1492 | 1492 | 1454 | 14.47 |  |
| 160502 | Krapkowice, gm. | 19525 | 3486 | 3481 | 3399 | 17.83 | |
| 160503 | Strzeleczki, gm. | 6199 | 706 | 706 | 678 | 11.39 | |
| 160504 | Walce, gm. | 4708 | 535 | 535 | 517 | 11.36 | |
| 160505 | Zdzieszowice, gm. | 13359 | 1997 | 1996 | 1935 | 14.94 | |
| |
krapkowicki |
54101 |
8216 |
8210 |
7983 |
15.18 |
 |
|
| |
| . |
. |
Turnout by location of ward electoral commission |
. |
. |
| . |
. |
| . |
. |
. |
. |
. |
. |
. |
. |
. |
. |
. |
. |
| No. |
Name |
No. entitled
to vote |
No. of ballot
papers issued |
No. of |
No. of total votes / No. entitled to vote
[%] |
| total votes |
valid votes |
| 1 | City | 29434 | 5113 | 5110 | 4992 | 17.36 | |
| 2 | Country | 24667 | 3103 | 3100 | 2991 | 12.57 | |
| . |
Turnout by number of inhabitants of commune |
. |
| 1 | to 5 000 | 0 | 0 | 0 | 0 | 0.00 | |
| 2 | from 5 001 to 10 000 | 10907 | 1241 | 1241 | 1195 | 11.38 | |
| 3 | from 10 001 to 20 000 | 23669 | 3489 | 3488 | 3389 | 14.74 | |
| 4 | from 20 001 to 50 000 | 19525 | 3486 | 3481 | 3399 | 17.83 | |
| 5 | from 50 001 to 100 000 | 0 | 0 | 0 | 0 | 0.00 | |
| 6 | from 100 001 to 200 000 | 0 | 0 | 0 | 0 | 0.00 | |
| 7 | from 200 001 to 500 000 | 0 | 0 | 0 | 0 | 0.00 | |
| 8 | over 500 000 | 0 | 0 | 0 | 0 | 0.00 | |
|
|


 Statistical DataLegal ActsElectoral BodiesElection Committees and CandidatesTurnoutResultsSearchDocumentsCreated by