|
|
| . |
. |
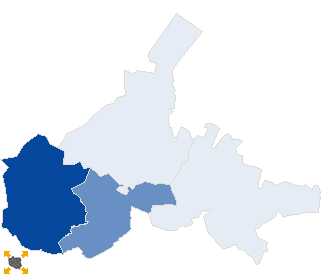
Voting results |
. |
. |
| . |
. |
| . |
. |
. |
. |
. |
. |
. |
. |
. |
. |
. |
. |
| No. |
Name |
No. entitled
to vote |
No. of ballot
papers issued |
No. of |
No. of total votes / No. entitled to vote
[%] |
| total votes |
valid votes |
| 161001 | Biała, gm. | 9106 | 1288 | 1288 | 1231 | 14.14 |  |
| 161002 | Głogówek, gm. | 11224 | 1533 | 1533 | 1487 | 13.66 | |
| 161003 | Lubrza, gm. | 3577 | 631 | 631 | 608 | 17.64 | |
| 161004 | Prudnik, gm. | 23283 | 4809 | 4806 | 4692 | 20.64 | |
| |
prudnicki |
47190 |
8261 |
8258 |
8018 |
17.50 |
 |
|
| |
| . |
. |
Turnout by location of ward electoral commission |
. |
. |
| . |
. |
| . |
. |
. |
. |
. |
. |
. |
. |
. |
. |
. |
. |
| No. |
Name |
No. entitled
to vote |
No. of ballot
papers issued |
No. of |
No. of total votes / No. entitled to vote
[%] |
| total votes |
valid votes |
| 1 | City | 25126 | 5218 | 5215 | 5068 | 20.76 | |
| 2 | Country | 22064 | 3043 | 3043 | 2950 | 13.79 | |
| . |
Turnout by number of inhabitants of commune |
. |
| 1 | to 5 000 | 3577 | 631 | 631 | 608 | 17.64 | |
| 2 | from 5 001 to 10 000 | 0 | 0 | 0 | 0 | 0.00 | |
| 3 | from 10 001 to 20 000 | 20330 | 2821 | 2821 | 2718 | 13.88 | |
| 4 | from 20 001 to 50 000 | 23283 | 4809 | 4806 | 4692 | 20.64 | |
| 5 | from 50 001 to 100 000 | 0 | 0 | 0 | 0 | 0.00 | |
| 6 | from 100 001 to 200 000 | 0 | 0 | 0 | 0 | 0.00 | |
| 7 | from 200 001 to 500 000 | 0 | 0 | 0 | 0 | 0.00 | |
| 8 | over 500 000 | 0 | 0 | 0 | 0 | 0.00 | |
|
|


 Statistical DataLegal ActsElectoral BodiesElection Committees and CandidatesTurnoutResultsSearchDocumentsCreated by