|
|
|
|
| |
| . |
. |
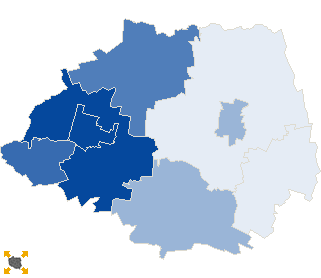
Turnout by location of ward electoral commission |
. |
. |
| . |
. |
| . |
. |
. |
. |
. |
. |
. |
. |
. |
. |
. |
. |
| No. |
Name |
No. entitled
to vote |
No. of ballot
papers issued |
No. of |
No. of total votes / No. entitled to vote
[%] |
| total votes |
valid votes |
| 1 | City | 25369 | 5033 | 5025 | 4944 | 19.81 |  |
| 2 | Country | 23922 | 4730 | 4729 | 4671 | 19.77 | |
| . |
Turnout by number of inhabitants of commune |
. |
| 1 | to 5 000 | 11685 | 2464 | 2460 | 2414 | 21.05 | |
| 2 | from 5 001 to 10 000 | 15419 | 3216 | 3216 | 3183 | 20.86 | |
| 3 | from 10 001 to 20 000 | 0 | 0 | 0 | 0 | 0.00 | |
| 4 | from 20 001 to 50 000 | 22187 | 4083 | 4078 | 4018 | 18.38 | |
| 5 | from 50 001 to 100 000 | 0 | 0 | 0 | 0 | 0.00 | |
| 6 | from 100 001 to 200 000 | 0 | 0 | 0 | 0 | 0.00 | |
| 7 | from 200 001 to 500 000 | 0 | 0 | 0 | 0 | 0.00 | |
| 8 | over 500 000 | 0 | 0 | 0 | 0 | 0.00 | |
|
|


 Statistical DataLegal ActsElectoral BodiesElection Committees and CandidatesTurnoutResultsSearchDocumentsCreated by