|
|
| . |
. |
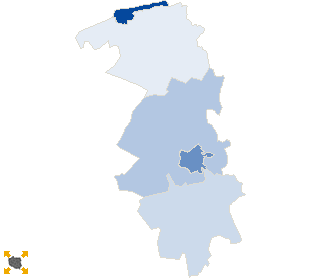
Voting results |
. |
. |
| . |
. |
| . |
. |
. |
. |
. |
. |
. |
. |
. |
. |
. |
. |
| No. |
Name |
No. entitled
to vote |
No. of ballot
papers issued |
No. of |
No. of total votes / No. entitled to vote
[%] |
| total votes |
valid votes |
| 220803 | Cewice, gm. | 5282 | 860 | 860 | 832 | 16.28 |  |
| 220801 | Lębork, m. | 27845 | 7106 | 7105 | 6984 | 25.52 | |
| 220802 | Łeba, m. | 3456 | 1311 | 1311 | 1261 | 37.93 | |
| 220804 | Nowa Wieś Lęborska, gm. | 9629 | 1834 | 1833 | 1796 | 19.04 | |
| 220805 | Wicko, gm. | 4379 | 555 | 555 | 543 | 12.67 | |
| |
lęborski |
50591 |
11666 |
11664 |
11416 |
23.06 |
 |
|
| |
| . |
. |
Turnout by location of ward electoral commission |
. |
. |
| . |
. |
| . |
. |
. |
. |
. |
. |
. |
. |
. |
. |
. |
. |
| No. |
Name |
No. entitled
to vote |
No. of ballot
papers issued |
No. of |
No. of total votes / No. entitled to vote
[%] |
| total votes |
valid votes |
| 1 | City | 31301 | 8417 | 8416 | 8245 | 26.89 | |
| 2 | Country | 19290 | 3249 | 3248 | 3171 | 16.84 | |
| . |
Turnout by number of inhabitants of commune |
. |
| 1 | to 5 000 | 3456 | 1311 | 1311 | 1261 | 37.93 | |
| 2 | from 5 001 to 10 000 | 9661 | 1415 | 1415 | 1375 | 14.65 | |
| 3 | from 10 001 to 20 000 | 9629 | 1834 | 1833 | 1796 | 19.04 | |
| 4 | from 20 001 to 50 000 | 27845 | 7106 | 7105 | 6984 | 25.52 | |
| 5 | from 50 001 to 100 000 | 0 | 0 | 0 | 0 | 0.00 | |
| 6 | from 100 001 to 200 000 | 0 | 0 | 0 | 0 | 0.00 | |
| 7 | from 200 001 to 500 000 | 0 | 0 | 0 | 0 | 0.00 | |
| 8 | over 500 000 | 0 | 0 | 0 | 0 | 0.00 | |
|
|


 Statistical DataLegal ActsElectoral BodiesElection Committees and CandidatesTurnoutResultsSearchDocumentsCreated by