|
|
| . |
. |
Voting results |
. |
. |
| . |
. |
| . |
. |
. |
. |
. |
. |
. |
. |
. |
. |
. |
. |
| No. |
Name |
No. entitled
to vote |
No. of ballot
papers issued |
No. of |
No. of total votes / No. entitled to vote
[%] |
| total votes |
valid votes |
| 221202 | Damnica, gm. | 4778 | 581 | 581 | 565 | 12.16 |  |
| 221203 | Dębnica Kaszubska, gm. | 7363 | 1008 | 1008 | 974 | 13.69 | |
| 221204 | Główczyce, gm. | 7375 | 916 | 916 | 876 | 12.42 | |
| 221205 | Kępice, gm. | 7356 | 1125 | 1125 | 1093 | 15.29 | |
| 221206 | Kobylnica, gm. | 7945 | 1207 | 1205 | 1181 | 15.17 | |
| 221207 | Potęgowo, gm. | 5477 | 604 | 604 | 586 | 11.03 | |
| 221208 | Słupsk, gm. | 11174 | 1770 | 1764 | 1735 | 15.79 | |
| 221209 | Smołdzino, gm. | 2752 | 373 | 373 | 363 | 13.55 | |
| 221210 | Ustka, gm. | 6038 | 1185 | 1185 | 1154 | 19.63 | |
| 221201 | Ustka, m. | 14307 | 3793 | 3791 | 3728 | 26.50 | |
| |
słupski |
74565 |
12562 |
12552 |
12255 |
16.83 |
 |
|
| |
| . |
. |
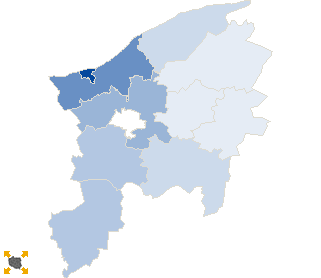
Turnout by location of ward electoral commission |
. |
. |
| . |
. |
| . |
. |
. |
. |
. |
. |
. |
. |
. |
. |
. |
. |
| No. |
Name |
No. entitled
to vote |
No. of ballot
papers issued |
No. of |
No. of total votes / No. entitled to vote
[%] |
| total votes |
valid votes |
| 1 | City | 17501 | 4383 | 4381 | 4302 | 25.03 | |
| 2 | Country | 57064 | 8179 | 8171 | 7953 | 14.32 | |
| . |
Turnout by number of inhabitants of commune |
. |
| 1 | to 5 000 | 2752 | 373 | 373 | 363 | 13.55 | |
| 2 | from 5 001 to 10 000 | 38387 | 5419 | 5419 | 5248 | 14.12 | |
| 3 | from 10 001 to 20 000 | 33426 | 6770 | 6760 | 6644 | 20.22 | |
| 4 | from 20 001 to 50 000 | 0 | 0 | 0 | 0 | 0.00 | |
| 5 | from 50 001 to 100 000 | 0 | 0 | 0 | 0 | 0.00 | |
| 6 | from 100 001 to 200 000 | 0 | 0 | 0 | 0 | 0.00 | |
| 7 | from 200 001 to 500 000 | 0 | 0 | 0 | 0 | 0.00 | |
| 8 | over 500 000 | 0 | 0 | 0 | 0 | 0.00 | |
|
|


 Statistical DataLegal ActsElectoral BodiesElection Committees and CandidatesTurnoutResultsSearchDocumentsCreated by