|
|
| . |
. |
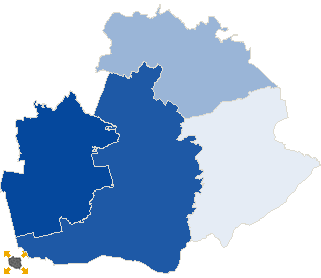
Voting results |
. |
. |
| . |
. |
| . |
. |
. |
. |
. |
. |
. |
. |
. |
. |
. |
. |
| No. |
Name |
No. entitled
to vote |
No. of ballot
papers issued |
No. of |
No. of total votes / No. entitled to vote
[%] |
| total votes |
valid votes |
| 281601 | Biała Piska, gm. | 9505 | 1242 | 1241 | 1203 | 13.06 |  |
| 281602 | Orzysz, gm. | 7624 | 1170 | 1169 | 1154 | 15.33 | |
| 281603 | Pisz, gm. | 21784 | 4048 | 4048 | 3972 | 18.58 | |
| 281604 | Ruciane-Nida, gm. | 7049 | 1384 | 1384 | 1346 | 19.63 | |
| |
piski |
45962 |
7844 |
7842 |
7675 |
17.06 |
 |
|
| |
| . |
. |
Turnout by location of ward electoral commission |
. |
. |
| . |
. |
| . |
. |
. |
. |
. |
. |
. |
. |
. |
. |
. |
. |
| No. |
Name |
No. entitled
to vote |
No. of ballot
papers issued |
No. of |
No. of total votes / No. entitled to vote
[%] |
| total votes |
valid votes |
| 1 | City | 30034 | 5938 | 5936 | 5822 | 19.76 | |
| 2 | Country | 15928 | 1906 | 1906 | 1853 | 11.97 | |
| . |
Turnout by number of inhabitants of commune |
. |
| 1 | to 5 000 | 0 | 0 | 0 | 0 | 0.00 | |
| 2 | from 5 001 to 10 000 | 14673 | 2554 | 2553 | 2500 | 17.40 | |
| 3 | from 10 001 to 20 000 | 9505 | 1242 | 1241 | 1203 | 13.06 | |
| 4 | from 20 001 to 50 000 | 21784 | 4048 | 4048 | 3972 | 18.58 | |
| 5 | from 50 001 to 100 000 | 0 | 0 | 0 | 0 | 0.00 | |
| 6 | from 100 001 to 200 000 | 0 | 0 | 0 | 0 | 0.00 | |
| 7 | from 200 001 to 500 000 | 0 | 0 | 0 | 0 | 0.00 | |
| 8 | over 500 000 | 0 | 0 | 0 | 0 | 0.00 | |
|
|


 Statistical DataLegal ActsElectoral BodiesElection Committees and CandidatesTurnoutResultsSearchDocumentsCreated by