|
|
| . |
. |
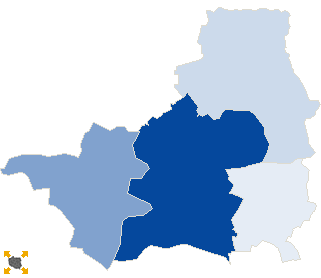
Voting results |
. |
. |
| . |
. |
| . |
. |
. |
. |
. |
. |
. |
. |
. |
. |
. |
. |
| No. |
Name |
No. entitled
to vote |
No. of ballot
papers issued |
No. of |
No. of total votes / No. entitled to vote
[%] |
| total votes |
valid votes |
| 300601 | Jaraczewo, gm. | 6456 | 1142 | 1141 | 1080 | 17.67 |  |
| 300602 | Jarocin, gm. | 36056 | 7768 | 7759 | 7544 | 21.52 |  |
| 300603 | Kotlin, gm. | 5564 | 773 | 772 | 735 | 13.87 |  |
| 300604 | Żerków, gm. | 8259 | 1212 | 1212 | 1149 | 14.67 |  |
| |
jarociński |
56335 |
10895 |
10884 |
10508 |
19.32 |
 |
|
| |
| . |
. |
Turnout by location of ward electoral commission |
. |
. |
| . |
. |
| . |
. |
. |
. |
. |
. |
. |
. |
. |
. |
. |
. |
| No. |
Name |
No. entitled
to vote |
No. of ballot
papers issued |
No. of |
No. of total votes / No. entitled to vote
[%] |
| total votes |
valid votes |
| 1 | City | 23137 | 5592 | 5591 | 5453 | 24.16 |  |
| 2 | Country | 33198 | 5303 | 5293 | 5055 | 15.94 |  |
| . |
Turnout by number of inhabitants of commune |
. |
| 1 | to 5 000 | 0 | 0 | 0 | 0 | 0.00 | |
| 2 | from 5 001 to 10 000 | 12020 | 1915 | 1913 | 1815 | 15.92 |  |
| 3 | from 10 001 to 20 000 | 8259 | 1212 | 1212 | 1149 | 14.67 |  |
| 4 | from 20 001 to 50 000 | 36056 | 7768 | 7759 | 7544 | 21.52 |  |
| 5 | from 50 001 to 100 000 | 0 | 0 | 0 | 0 | 0.00 | |
| 6 | from 100 001 to 200 000 | 0 | 0 | 0 | 0 | 0.00 | |
| 7 | from 200 001 to 500 000 | 0 | 0 | 0 | 0 | 0.00 | |
| 8 | over 500 000 | 0 | 0 | 0 | 0 | 0.00 | |
|
|


 Statistical DataLegal ActsElectoral BodiesElection Committees and CandidatesTurnoutResultsSearchDocumentsCreated by

 Statistical Data Legal Acts Electoral Bodies Election Committees and Candidates Turnout Results Search Documents Created by


