|
|
| . |
. |
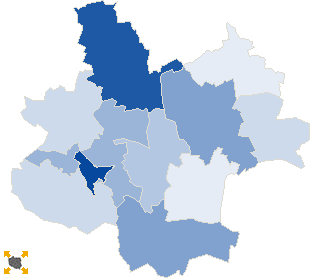
Voting results |
. |
. |
| . |
. |
| . |
. |
. |
. |
. |
. |
. |
. |
. |
. |
. |
. |
| No. |
Name |
No. entitled
to vote |
No. of ballot
papers issued |
No. of |
No. of total votes / No. entitled to vote
[%] |
| total votes |
valid votes |
| 300902 | Babiak, gm. | 6311 | 1340 | 1339 | 1301 | 21.22 |  |
| 300903 | Chodów, gm. | 2865 | 362 | 362 | 344 | 12.64 | |
| 300904 | Dąbie, gm. | 5406 | 875 | 870 | 833 | 16.09 | |
| 300905 | Grzegorzew, gm. | 4405 | 625 | 625 | 606 | 14.19 | |
| 300906 | Kłodawa, gm. | 10879 | 1740 | 1740 | 1683 | 15.99 | |
| 300907 | Koło, gm. | 5719 | 852 | 852 | 830 | 14.90 | |
| 300901 | Koło, m. | 19127 | 4431 | 4431 | 4315 | 23.17 | |
| 300908 | Kościelec, gm. | 5135 | 649 | 649 | 630 | 12.64 | |
| 300909 | Olszówka, gm. | 3776 | 409 | 409 | 389 | 10.83 | |
| 300910 | Osiek Mały, gm. | 4480 | 555 | 555 | 536 | 12.39 | |
| 300911 | Przedecz, gm. | 3508 | 406 | 406 | 386 | 11.57 | |
| |
kolski |
71611 |
12244 |
12238 |
11853 |
17.09 |
 |
|
| |
| . |
. |
Turnout by location of ward electoral commission |
. |
. |
| . |
. |
| . |
. |
. |
. |
. |
. |
. |
. |
. |
. |
. |
. |
| No. |
Name |
No. entitled
to vote |
No. of ballot
papers issued |
No. of |
No. of total votes / No. entitled to vote
[%] |
| total votes |
valid votes |
| 1 | City | 27861 | 6062 | 6062 | 5890 | 21.76 | |
| 2 | Country | 43750 | 6182 | 6176 | 5963 | 14.12 | |
| . |
Turnout by number of inhabitants of commune |
. |
| 1 | to 5 000 | 10149 | 1177 | 1177 | 1119 | 11.60 | |
| 2 | from 5 001 to 10 000 | 31456 | 4896 | 4890 | 4736 | 15.55 | |
| 3 | from 10 001 to 20 000 | 10879 | 1740 | 1740 | 1683 | 15.99 | |
| 4 | from 20 001 to 50 000 | 19127 | 4431 | 4431 | 4315 | 23.17 | |
| 5 | from 50 001 to 100 000 | 0 | 0 | 0 | 0 | 0.00 | |
| 6 | from 100 001 to 200 000 | 0 | 0 | 0 | 0 | 0.00 | |
| 7 | from 200 001 to 500 000 | 0 | 0 | 0 | 0 | 0.00 | |
| 8 | over 500 000 | 0 | 0 | 0 | 0 | 0.00 | |
|
|


 Statistical DataLegal ActsElectoral BodiesElection Committees and CandidatesTurnoutResultsSearchDocumentsCreated by