|
|
|
|
| |
| . |
. |
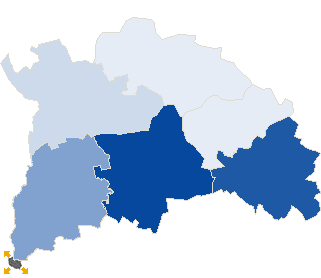
Turnout by location of ward electoral commission |
. |
. |
| . |
. |
| . |
. |
. |
. |
. |
. |
. |
. |
. |
. |
. |
. |
| No. |
Name |
No. entitled
to vote |
No. of ballot
papers issued |
No. of |
No. of total votes / No. entitled to vote
[%] |
| total votes |
valid votes |
| 1 | City | 27685 | 7319 | 7291 | 7072 | 26.34 |  |
| 2 | Country | 28784 | 4816 | 4801 | 4630 | 16.68 | |
| . |
Turnout by number of inhabitants of commune |
. |
| 1 | to 5 000 | 2947 | 533 | 524 | 502 | 17.78 | |
| 2 | from 5 001 to 10 000 | 11224 | 1889 | 1888 | 1821 | 16.82 | |
| 3 | from 10 001 to 20 000 | 22868 | 4988 | 4966 | 4772 | 21.72 | |
| 4 | from 20 001 to 50 000 | 19430 | 4725 | 4714 | 4607 | 24.26 | |
| 5 | from 50 001 to 100 000 | 0 | 0 | 0 | 0 | 0.00 | |
| 6 | from 100 001 to 200 000 | 0 | 0 | 0 | 0 | 0.00 | |
| 7 | from 200 001 to 500 000 | 0 | 0 | 0 | 0 | 0.00 | |
| 8 | over 500 000 | 0 | 0 | 0 | 0 | 0.00 | |
|
|


 Statistical DataLegal ActsElectoral BodiesElection Committees and CandidatesTurnoutResultsSearchDocumentsCreated by