|
|
|
|
| |
| . |
. |
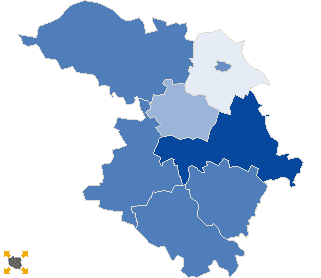
Turnout by location of ward electoral commission |
. |
. |
| . |
. |
| . |
. |
. |
. |
. |
. |
. |
. |
. |
. |
. |
. |
| No. |
Name |
No. entitled
to vote |
No. of ballot
papers issued |
No. of |
No. of total votes / No. entitled to vote
[%] |
| total votes |
valid votes |
| 1 | City | 36842 | 8625 | 8592 | 8367 | 23.32 |  |
| 2 | Country | 33357 | 5630 | 5627 | 5399 | 16.87 | |
| . |
Turnout by number of inhabitants of commune |
. |
| 1 | to 5 000 | 9012 | 1413 | 1413 | 1350 | 15.68 | |
| 2 | from 5 001 to 10 000 | 12184 | 2412 | 2411 | 2309 | 19.79 | |
| 3 | from 10 001 to 20 000 | 26038 | 5121 | 5105 | 4960 | 19.61 | |
| 4 | from 20 001 to 50 000 | 22965 | 5309 | 5290 | 5147 | 23.04 | |
| 5 | from 50 001 to 100 000 | 0 | 0 | 0 | 0 | 0.00 | |
| 6 | from 100 001 to 200 000 | 0 | 0 | 0 | 0 | 0.00 | |
| 7 | from 200 001 to 500 000 | 0 | 0 | 0 | 0 | 0.00 | |
| 8 | over 500 000 | 0 | 0 | 0 | 0 | 0.00 | |
|
|


 Statistical DataLegal ActsElectoral BodiesElection Committees and CandidatesTurnoutResultsSearchDocumentsCreated by