|
|
| . |
. |
Number of people entitled to vote, number of ballot papers issued |
. |
. |
| . |
. |
| . |
. |
. |
. |
. |
. |
. |
. |
. |
. |
. |
. |
| No. |
Name |
No. of polling |
No. of people
entitled to vote |
No. of
ballot papers
issued |
No. of ballot papers issued / No. of people entitled to vote [%] |
| wards |
wards which
transmitted the results |
| 022001 | Oborniki Śląskie, gm. | 11 | 11 | 14654 | 872 | 5.95 |  |
| 022002 | Prusice, gm. | 5 | 5 | 7284 | 202 | 2.77 | |
| 022003 | Trzebnica, gm. | 10 | 10 | 17609 | 812 | 4.61 | |
| 022004 | Wisznia Mała, gm. | 4 | 4 | 6849 | 368 | 5.37 | |
| 022005 | Zawonia, gm. | 3 | 3 | 4378 | 125 | 2.86 | |
| 022006 | Żmigród, gm. | 10 | 10 | 11918 | 420 | 3.52 | |
| |
trzebnicki |
43 |
43 |
62692 |
2799 |
4.46 |
 |
|
| |
| . |
. |
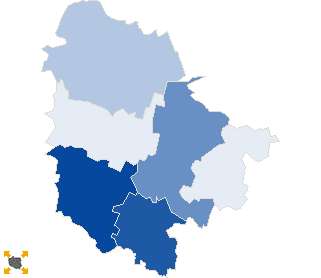
Turnout by location of ward electoral commission |
. |
. |
| . |
. |
| . |
. |
. |
. |
. |
. |
. |
. |
. |
. |
. |
. |
| No. |
Name |
No. of polling |
No. of people
entitled to vote |
No. of
ballot papers
issued |
No. of ballot papers issued / No. of people entitled to vote [%] |
| wards |
wards which
transmitted the results |
| 1 | rural commune | 7 | 7 | 11227 | 493 | 4.39 | |
| 2 | urban - rural commune | 36 | 36 | 51465 | 2306 | 4.48 | |
|
|


 Statistical DataLegal ActsElectoral BodiesElection Committees and CandidatesTurnoutResultsSearchDocumentsCreated by