|
|
| . |
. |
Number of people entitled to vote, number of ballot papers issued |
. |
. |
| . |
. |
| . |
. |
. |
. |
. |
. |
. |
. |
. |
. |
. |
. |
| No. |
Name |
No. of polling |
No. of people
entitled to vote |
No. of
ballot papers
issued |
No. of ballot papers issued / No. of people entitled to vote [%] |
| wards |
wards which
transmitted the results |
| 061201 | Chodel, gm. | 5 | 5 | 5284 | 499 | 9.44 |  |
| 061202 | Józefów nad Wisłą, gm. | 6 | 6 | 5753 | 190 | 3.30 | |
| 061203 | Karczmiska, gm. | 6 | 6 | 4831 | 191 | 3.95 | |
| 061204 | Łaziska, gm. | 6 | 6 | 4254 | 174 | 4.09 | |
| 061205 | Opole Lubelskie, gm. | 16 | 16 | 14548 | 621 | 4.27 | |
| 061206 | Poniatowa, gm. | 12 | 12 | 12485 | 576 | 4.61 | |
| 061207 | Wilków, gm. | 8 | 8 | 3956 | 157 | 3.97 | |
| |
opolski |
59 |
59 |
51111 |
2408 |
4.71 |
 |
|
| |
| . |
. |
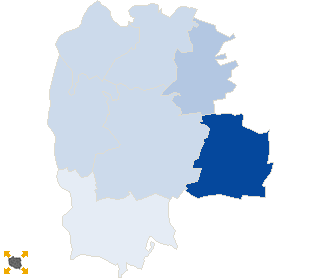
Turnout by location of ward electoral commission |
. |
. |
| . |
. |
| . |
. |
. |
. |
. |
. |
. |
. |
. |
. |
. |
. |
| No. |
Name |
No. of polling |
No. of people
entitled to vote |
No. of
ballot papers
issued |
No. of ballot papers issued / No. of people entitled to vote [%] |
| wards |
wards which
transmitted the results |
| 1 | rural commune | 31 | 31 | 24078 | 1211 | 5.03 | |
| 2 | urban - rural commune | 28 | 28 | 27033 | 1197 | 4.43 | |
|
|


 Statistical DataLegal ActsElectoral BodiesElection Committees and CandidatesTurnoutResultsSearchDocumentsCreated by