|
|
| . |
. |
Number of people entitled to vote, number of ballot papers issued |
. |
. |
| . |
. |
| . |
. |
. |
. |
. |
. |
. |
. |
. |
. |
. |
. |
| No. |
Name |
No. of polling |
No. of people
entitled to vote |
No. of
ballot papers
issued |
No. of ballot papers issued / No. of people entitled to vote [%] |
| wards |
wards which
transmitted the results |
| 241001 | Goczałkowice-Zdrój, gm. | 5 | 5 | 5078 | 420 | 8.27 |  |
| 241002 | Kobiór, gm. | 2 | 2 | 3741 | 280 | 7.48 | |
| 241003 | Miedźna, gm. | 10 | 10 | 12125 | 810 | 6.68 | |
| 241004 | Pawłowice, gm. | 11 | 11 | 13676 | 878 | 6.42 | |
| 241005 | Pszczyna, gm. | 28 | 28 | 38886 | 3380 | 8.69 | |
| 241006 | Suszec, gm. | 7 | 7 | 8450 | 669 | 7.92 | |
| |
pszczyński |
63 |
63 |
81956 |
6437 |
7.85 |
 |
|
| |
| . |
. |
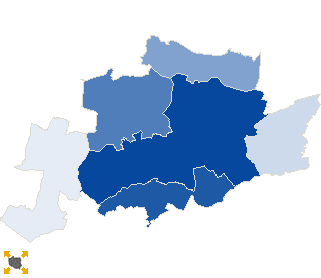
Turnout by location of ward electoral commission |
. |
. |
| . |
. |
| . |
. |
. |
. |
. |
. |
. |
. |
. |
. |
. |
. |
| No. |
Name |
No. of polling |
No. of people
entitled to vote |
No. of
ballot papers
issued |
No. of ballot papers issued / No. of people entitled to vote [%] |
| wards |
wards which
transmitted the results |
| 1 | rural commune | 35 | 35 | 43070 | 3057 | 7.10 | |
| 2 | urban - rural commune | 28 | 28 | 38886 | 3380 | 8.69 | |
|
|


 Statistical DataLegal ActsElectoral BodiesElection Committees and CandidatesTurnoutResultsSearchDocumentsCreated by