|
|
| . |
. |
Number of people entitled to vote, number of ballot papers issued |
. |
. |
| . |
. |
| . |
. |
. |
. |
. |
. |
. |
. |
. |
. |
. |
. |
| No. |
Name |
No. of polling |
No. of people
entitled to vote |
No. of
ballot papers
issued |
No. of ballot papers issued / No. of people entitled to vote [%] |
| wards |
wards which
transmitted the results |
| 241603 | Irządze, gm. | 3 | 3 | 2298 | 94 | 4.09 |  |
| 241604 | Kroczyce, gm. | 5 | 5 | 4998 | 243 | 4.86 | |
| 241605 | Łazy, gm. | 10 | 10 | 13318 | 798 | 5.99 | |
| 241606 | Ogrodzieniec, gm. | 6 | 6 | 7927 | 291 | 3.67 | |
| 241607 | Pilica, gm. | 7 | 7 | 7473 | 420 | 5.62 | |
| 241601 | Poręba, m. | 5 | 5 | 7325 | 414 | 5.65 | |
| 241608 | Szczekociny, gm. | 10 | 10 | 6928 | 364 | 5.25 | |
| 241609 | Włodowice, gm. | 4 | 4 | 4341 | 137 | 3.16 | |
| 241602 | Zawiercie, m. | 34 | 34 | 44300 | 2814 | 6.35 | |
| 241610 | Żarnowiec, gm. | 7 | 7 | 3874 | 203 | 5.24 | |
| |
zawierciański |
91 |
91 |
102782 |
5778 |
5.62 |
 |
|
| |
| . |
. |
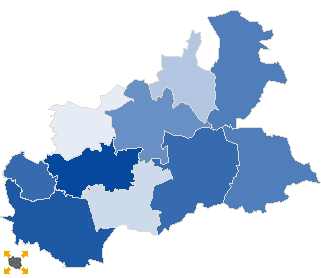
Turnout by location of ward electoral commission |
. |
. |
| . |
. |
| . |
. |
. |
. |
. |
. |
. |
. |
. |
. |
. |
. |
| No. |
Name |
No. of polling |
No. of people
entitled to vote |
No. of
ballot papers
issued |
No. of ballot papers issued / No. of people entitled to vote [%] |
| wards |
wards which
transmitted the results |
| 1 | rural commune | 19 | 19 | 15511 | 677 | 4.36 | |
| 2 | urban - rural commune | 33 | 33 | 35646 | 1873 | 5.25 | |
| 3 | urban commune | 39 | 39 | 51625 | 3228 | 6.25 | |
|
|


 Statistical DataLegal ActsElectoral BodiesElection Committees and CandidatesTurnoutResultsSearchDocumentsCreated by