|
|
| . |
. |
Number of people entitled to vote, number of ballot papers issued |
. |
. |
| . |
. |
| . |
. |
. |
. |
. |
. |
. |
. |
. |
. |
. |
. |
| No. |
Name |
No. of polling |
No. of people
entitled to vote |
No. of
ballot papers
issued |
No. of ballot papers issued / No. of people entitled to vote [%] |
| wards |
wards which
transmitted the results |
| 022001 | Oborniki Śląskie, gm. | 11 | 11 | 14662 | 2684 | 18.31 |  |
| 022002 | Prusice, gm. | 5 | 5 | 7269 | 658 | 9.05 | |
| 022003 | Trzebnica, gm. | 10 | 10 | 17611 | 2554 | 14.50 | |
| 022004 | Wisznia Mała, gm. | 4 | 4 | 6825 | 1137 | 16.66 | |
| 022005 | Zawonia, gm. | 3 | 3 | 4381 | 436 | 9.95 | |
| 022006 | Żmigród, gm. | 10 | 10 | 11926 | 1340 | 11.24 | |
| |
trzebnicki |
43 |
43 |
62674 |
8809 |
14.06 |
 |
|
| |
| . |
. |
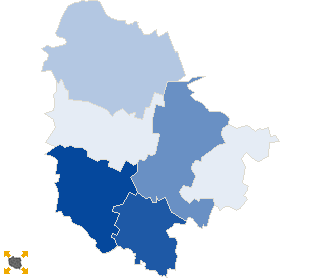
Turnout by location of ward electoral commission |
. |
. |
| . |
. |
| . |
. |
. |
. |
. |
. |
. |
. |
. |
. |
. |
. |
| No. |
Name |
No. of polling |
No. of people
entitled to vote |
No. of
ballot papers
issued |
No. of ballot papers issued / No. of people entitled to vote [%] |
| wards |
wards which
transmitted the results |
| 1 | rural commune | 7 | 7 | 11206 | 1573 | 14.04 | |
| 2 | urban - rural commune | 36 | 36 | 51468 | 7236 | 14.06 | |
|
|


 Statistical DataLegal ActsElectoral BodiesElection Committees and CandidatesTurnoutResultsSearchDocumentsCreated by