|
|
| . |
. |
Number of people entitled to vote, number of ballot papers issued |
. |
. |
| . |
. |
| . |
. |
. |
. |
. |
. |
. |
. |
. |
. |
. |
. |
| No. |
Name |
No. of polling |
No. of people
entitled to vote |
No. of
ballot papers
issued |
No. of ballot papers issued / No. of people entitled to vote [%] |
| wards |
wards which
transmitted the results |
| 120502 | Biecz, gm. | 13 | 13 | 13501 | 2295 | 17.00 |  |
| 120503 | Bobowa, gm. | 8 | 8 | 6936 | 1540 | 22.20 | |
| 120504 | Gorlice, gm. | 11 | 11 | 13018 | 2449 | 18.81 | |
| 120501 | Gorlice, m. | 22 | 22 | 24457 | 5306 | 21.70 | |
| 120505 | Lipinki, gm. | 7 | 7 | 5431 | 977 | 17.99 | |
| 120506 | Łużna, gm. | 7 | 7 | 6401 | 1118 | 17.47 | |
| 120507 | Moszczenica, gm. | 3 | 3 | 3733 | 502 | 13.45 | |
| 120508 | Ropa, gm. | 4 | 4 | 3827 | 746 | 19.49 | |
| 120509 | Sękowa, gm. | 6 | 6 | 3854 | 683 | 17.72 | |
| 120510 | Uście Gorlickie, gm. | 10 | 10 | 4990 | 965 | 19.34 | |
| |
gorlicki |
91 |
91 |
86148 |
16581 |
19.25 |
 |
|
| |
| . |
. |
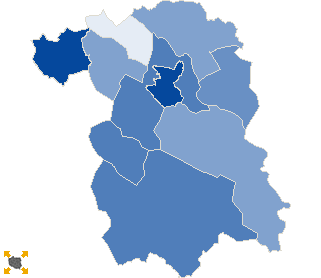
Turnout by location of ward electoral commission |
. |
. |
| . |
. |
| . |
. |
. |
. |
. |
. |
. |
. |
. |
. |
. |
. |
| No. |
Name |
No. of polling |
No. of people
entitled to vote |
No. of
ballot papers
issued |
No. of ballot papers issued / No. of people entitled to vote [%] |
| wards |
wards which
transmitted the results |
| 1 | rural commune | 48 | 48 | 41254 | 7440 | 18.03 | |
| 2 | urban - rural commune | 21 | 21 | 20437 | 3835 | 18.76 | |
| 3 | urban commune | 22 | 22 | 24457 | 5306 | 21.70 | |
|
|


 Statistical DataLegal ActsElectoral BodiesElection Committees and CandidatesTurnoutResultsSearchDocumentsCreated by