|
|
| . |
. |
Number of people entitled to vote, number of ballot papers issued |
. |
. |
| . |
. |
| . |
. |
. |
. |
. |
. |
. |
. |
. |
. |
. |
. |
| No. |
Name |
No. of polling |
No. of people
entitled to vote |
No. of
ballot papers
issued |
No. of ballot papers issued / No. of people entitled to vote [%] |
| wards |
wards which
transmitted the results |
| 241603 | Irządze, gm. | 3 | 3 | 2298 | 238 | 10.36 |  |
| 241604 | Kroczyce, gm. | 5 | 5 | 4998 | 581 | 11.62 | |
| 241605 | Łazy, gm. | 10 | 10 | 13325 | 2178 | 16.35 | |
| 241606 | Ogrodzieniec, gm. | 6 | 6 | 7929 | 1097 | 13.84 | |
| 241607 | Pilica, gm. | 7 | 7 | 7476 | 1004 | 13.43 | |
| 241601 | Poręba, m. | 5 | 5 | 7327 | 1071 | 14.62 | |
| 241608 | Szczekociny, gm. | 10 | 10 | 6937 | 890 | 12.83 | |
| 241609 | Włodowice, gm. | 4 | 4 | 4343 | 450 | 10.36 | |
| 241602 | Zawiercie, m. | 34 | 34 | 44314 | 7727 | 17.44 | |
| 241610 | Żarnowiec, gm. | 7 | 7 | 3874 | 482 | 12.44 | |
| |
zawierciański |
91 |
91 |
102821 |
15718 |
15.29 |
 |
|
| |
| . |
. |
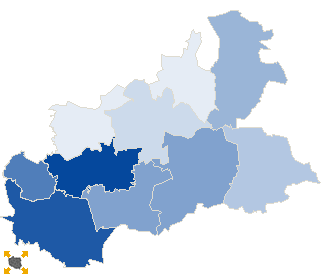
Turnout by location of ward electoral commission |
. |
. |
| . |
. |
| . |
. |
. |
. |
. |
. |
. |
. |
. |
. |
. |
. |
| No. |
Name |
No. of polling |
No. of people
entitled to vote |
No. of
ballot papers
issued |
No. of ballot papers issued / No. of people entitled to vote [%] |
| wards |
wards which
transmitted the results |
| 1 | rural commune | 19 | 19 | 15513 | 1751 | 11.29 | |
| 2 | urban - rural commune | 33 | 33 | 35667 | 5169 | 14.49 | |
| 3 | urban commune | 39 | 39 | 51641 | 8798 | 17.04 | |
|
|


 Statistical DataLegal ActsElectoral BodiesElection Committees and CandidatesTurnoutResultsSearchDocumentsCreated by