|
|
| . |
. |
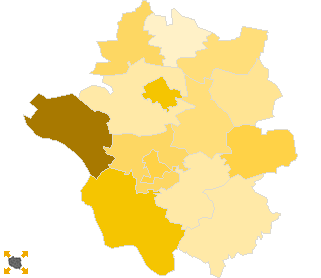
Voting Results for Committee. |
. |
. |
| . |
. |
| . |
. |
. |
. |
. |
. |
. |
. |
. |
. |
. |
. |
. |
| No. |
Name |
No. of entitled
to vote |
No. of ballot papers
issued |
No. of votes |
No. of votes: per list / valid [%] |
| total |
valid |
per List |
| 140303 | Borowie, gm. | 3966 | 628 | 628 | 612 | 21 | 3.43 |  |
| 140304 | Garwolin, gm. | 9359 | 1838 | 1838 | 1809 | 49 | 2.71 | |
| 140301 | Garwolin, m. | 13108 | 3430 | 3430 | 3378 | 175 | 5.18 | |
| 140305 | Górzno, gm. | 4791 | 805 | 801 | 792 | 28 | 3.54 | |
| 140306 | Łaskarzew, gm. | 4091 | 663 | 663 | 642 | 26 | 4.05 | |
| 140302 | Łaskarzew, m. | 3877 | 735 | 735 | 723 | 32 | 4.43 | |
| 140307 | Maciejowice, gm. | 5932 | 1023 | 1022 | 996 | 49 | 4.92 | |
| 140308 | Miastków Kościelny, gm. | 4049 | 649 | 649 | 633 | 19 | 3.00 | |
| 140309 | Parysów, gm. | 3151 | 524 | 524 | 503 | 10 | 1.99 | |
| 140310 | Pilawa, gm. | 8200 | 1578 | 1578 | 1536 | 62 | 4.04 | |
| 140311 | Sobolew, gm. | 6434 | 1157 | 1157 | 1130 | 29 | 2.57 | |
| 140312 | Trojanów, gm. | 6118 | 1013 | 1012 | 990 | 27 | 2.73 | |
| 140313 | Wilga, gm. | 4203 | 817 | 817 | 797 | 53 | 6.65 | |
| 140314 | Żelechów, gm. | 6685 | 1326 | 1326 | 1287 | 58 | 4.51 | |
| |
garwoliński |
83964 |
16186 |
16180 |
15828 |
638 |
4.03 |
 |
|
| |
| . |
. |
Voting Results by location of ward electoral commission. |
. |
. |
| . |
. |
| . |
. |
. |
. |
. |
. |
. |
. |
. |
. |
. |
. |
. |
| No. |
Name |
No. of entitled
to vote |
No. of ballot
papers issued |
No. of votes |
No. of votes: per list / valid [%] |
| total |
valid |
per List |
| 1 | City | 23501 | 5617 | 5617 | 5517 | 269 | 4.88 | |
| 2 | Country | 60463 | 10569 | 10563 | 10311 | 369 | 3.58 | |
| . |
Voting Results by number of inhabitants of commune |
. |
| 1 | to 5 000 | 7028 | 1259 | 1259 | 1226 | 42 | 3.43 | |
| 2 | from 5 001 to 10 000 | 46269 | 8081 | 8075 | 7879 | 310 | 3.93 | |
| 3 | from 10 001 to 20 000 | 30667 | 6846 | 6846 | 6723 | 286 | 4.25 | |
| 4 | from 20 001 to 50 000 | 0 | 0 | 0 | 0 | 0 | 0.00 | |
| 5 | from 50 001 to 100 000 | 0 | 0 | 0 | 0 | 0 | 0.00 | |
| 6 | from 100 001 to 200 000 | 0 | 0 | 0 | 0 | 0 | 0.00 | |
| 7 | from 200 001 to 500 000 | 0 | 0 | 0 | 0 | 0 | 0.00 | |
| 8 | over 500 000 | 0 | 0 | 0 | 0 | 0 | 0.00 | |
|
|


 Statistical DataLegal ActsElectoral BodiesElection Committees and CandidatesTurnoutResultsSearchDocumentsCreated by