|
|
| . |
. |
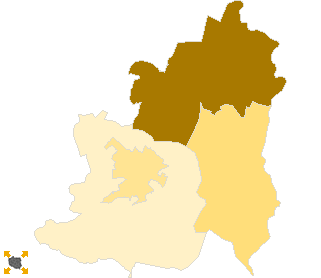
Voting Results for Committee. |
. |
. |
| . |
. |
| . |
. |
. |
. |
. |
. |
. |
. |
. |
. |
. |
. |
. |
| No. |
Name |
No. of entitled
to vote |
No. of ballot papers
issued |
No. of votes |
No. of votes: per list / valid [%] |
| total |
valid |
per List |
| 021102 | Lubin, gm. | 9666 | 1874 | 1874 | 1829 | 8 | 0.44 |  |
| 021101 | Lubin, m. | 62281 | 14929 | 14910 | 14695 | 88 | 0.60 |  |
| 021103 | Rudna, gm. | 5809 | 977 | 977 | 933 | 10 | 1.07 |  |
| 021104 | Ścinawa, gm. | 8478 | 1487 | 1485 | 1459 | 10 | 0.69 |  |
| |
lubiński |
86234 |
19267 |
19246 |
18916 |
116 |
0.61 |
 |
|
| |
| . |
. |
Voting Results by location of ward electoral commission. |
. |
. |
| . |
. |
| . |
. |
. |
. |
. |
. |
. |
. |
. |
. |
. |
. |
. |
| No. |
Name |
No. of entitled
to vote |
No. of ballot
papers issued |
No. of votes |
No. of votes: per list / valid [%] |
| total |
valid |
per List |
| 1 | City | 67806 | 15904 | 15885 | 15654 | 97 | 0.62 |  |
| 2 | Country | 18428 | 3363 | 3361 | 3262 | 19 | 0.58 |  |
| . |
Voting Results by number of inhabitants of commune |
. |
| 1 | to 5 000 | 0 | 0 | 0 | 0 | 0 | 0.00 | |
| 2 | from 5 001 to 10 000 | 5809 | 977 | 977 | 933 | 10 | 1.07 |  |
| 3 | from 10 001 to 20 000 | 18144 | 3361 | 3359 | 3288 | 18 | 0.55 |  |
| 4 | from 20 001 to 50 000 | 0 | 0 | 0 | 0 | 0 | 0.00 | |
| 5 | from 50 001 to 100 000 | 62281 | 14929 | 14910 | 14695 | 88 | 0.60 |  |
| 6 | from 100 001 to 200 000 | 0 | 0 | 0 | 0 | 0 | 0.00 | |
| 7 | from 200 001 to 500 000 | 0 | 0 | 0 | 0 | 0 | 0.00 | |
| 8 | over 500 000 | 0 | 0 | 0 | 0 | 0 | 0.00 | |
|
|


 Statistical DataLegal ActsElectoral BodiesElection Committees and CandidatesTurnoutResultsSearchDocumentsCreated by
 Statistical Data Legal Acts Electoral Bodies Election Committees and Candidates Turnout Results Search Documents Created by


