|
|
| . |
. |
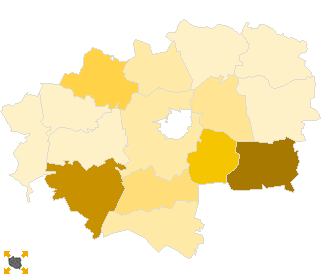
Voting Results for Committee. |
. |
. |
| . |
. |
| . |
. |
. |
. |
. |
. |
. |
. |
. |
. |
. |
. |
. |
| No. |
Name |
No. of entitled
to vote |
No. of ballot papers
issued |
No. of votes |
No. of votes: per list / valid [%] |
| total |
valid |
per List |
| 062001 | Adamów, gm. | 3961 | 676 | 676 | 661 | 5 | 0.76 |  |
| 062002 | Grabowiec, gm. | 3804 | 493 | 492 | 478 | 2 | 0.42 | |
| 062003 | Komarów-Osada, gm. | 4475 | 1161 | 1161 | 1123 | 15 | 1.34 | |
| 062004 | Krasnobród, gm. | 5762 | 1425 | 1424 | 1389 | 8 | 0.58 | |
| 062005 | Łabunie, gm. | 4930 | 1135 | 1135 | 1118 | 12 | 1.07 | |
| 062006 | Miączyn, gm. | 4976 | 1078 | 1078 | 1034 | 5 | 0.48 | |
| 062007 | Nielisz, gm. | 4818 | 621 | 621 | 604 | 6 | 0.99 | |
| 062008 | Radecznica, gm. | 5429 | 1019 | 1019 | 1007 | 5 | 0.50 | |
| 062009 | Sitno, gm. | 5502 | 1121 | 1121 | 1082 | 7 | 0.65 | |
| 062010 | Skierbieszów, gm. | 4542 | 887 | 886 | 864 | 4 | 0.46 | |
| 062011 | Stary Zamość, gm. | 4387 | 770 | 770 | 749 | 4 | 0.53 | |
| 062012 | Sułów, gm. | 4060 | 479 | 479 | 465 | 2 | 0.43 | |
| 062013 | Szczebrzeszyn, gm. | 9791 | 1589 | 1589 | 1551 | 7 | 0.45 | |
| 062014 | Zamość, gm. | 16712 | 3213 | 3213 | 3133 | 19 | 0.61 | |
| 062015 | Zwierzyniec, gm. | 5862 | 977 | 977 | 957 | 12 | 1.25 | |
| |
zamojski |
89011 |
16644 |
16641 |
16215 |
113 |
0.70 |
 |
|
| |
| . |
. |
Voting Results by location of ward electoral commission. |
. |
. |
| . |
. |
| . |
. |
. |
. |
. |
. |
. |
. |
. |
. |
. |
. |
. |
| No. |
Name |
No. of entitled
to vote |
No. of ballot
papers issued |
No. of votes |
No. of votes: per list / valid [%] |
| total |
valid |
per List |
| 1 | City | 9986 | 2175 | 2175 | 2124 | 17 | 0.80 | |
| 2 | Country | 79025 | 14469 | 14466 | 14091 | 96 | 0.68 | |
| . |
Voting Results by number of inhabitants of commune |
. |
| 1 | to 5 000 | 3804 | 493 | 492 | 478 | 2 | 0.42 | |
| 2 | from 5 001 to 10 000 | 58704 | 11349 | 11347 | 11053 | 85 | 0.77 | |
| 3 | from 10 001 to 20 000 | 9791 | 1589 | 1589 | 1551 | 7 | 0.45 | |
| 4 | from 20 001 to 50 000 | 16712 | 3213 | 3213 | 3133 | 19 | 0.61 | |
| 5 | from 50 001 to 100 000 | 0 | 0 | 0 | 0 | 0 | 0.00 | |
| 6 | from 100 001 to 200 000 | 0 | 0 | 0 | 0 | 0 | 0.00 | |
| 7 | from 200 001 to 500 000 | 0 | 0 | 0 | 0 | 0 | 0.00 | |
| 8 | over 500 000 | 0 | 0 | 0 | 0 | 0 | 0.00 | |
|
|


 Statistical DataLegal ActsElectoral BodiesElection Committees and CandidatesTurnoutResultsSearchDocumentsCreated by