|
|
| . |
. |
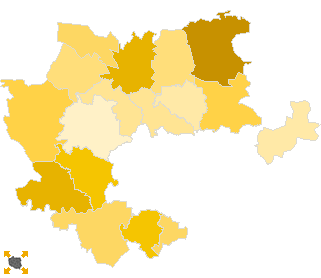
Voting Results for Committee. |
. |
. |
| . |
. |
| . |
. |
. |
. |
. |
. |
. |
. |
. |
. |
. |
. |
. |
| No. |
Name |
No. of entitled
to vote |
No. of ballot papers
issued |
No. of votes |
No. of votes: per list / valid [%] |
| total |
valid |
per List |
| 120601 | Czernichów, gm. | 10384 | 1980 | 1980 | 1948 | 11 | 0.56 |  |
| 120602 | Igołomia-Wawrzeńczyce, gm. | 6043 | 779 | 774 | 770 | 2 | 0.26 | |
| 120603 | Iwanowice, gm. | 6563 | 1325 | 1324 | 1293 | 5 | 0.39 | |
| 120604 | Jerzmanowice-Przeginia, gm. | 8300 | 1602 | 1600 | 1571 | 6 | 0.38 | |
| 120605 | Kocmyrzów-Luborzyca, gm. | 10356 | 1915 | 1914 | 1884 | 9 | 0.48 | |
| 120606 | Krzeszowice, gm. | 25870 | 6536 | 6533 | 6413 | 29 | 0.45 | |
| 120607 | Liszki, gm. | 12302 | 2857 | 2857 | 2808 | 15 | 0.53 | |
| 120608 | Michałowice, gm. | 6427 | 1525 | 1525 | 1507 | 4 | 0.27 | |
| 120609 | Mogilany, gm. | 8855 | 2470 | 2470 | 2433 | 12 | 0.49 | |
| 120610 | Skała, gm. | 7617 | 1685 | 1685 | 1658 | 9 | 0.54 | |
| 120611 | Skawina, gm. | 33072 | 8310 | 8301 | 8183 | 36 | 0.44 | |
| 120612 | Słomniki, gm. | 10932 | 2186 | 2182 | 2119 | 13 | 0.61 | |
| 120613 | Sułoszowa, gm. | 4588 | 1007 | 1007 | 972 | 4 | 0.41 | |
| 120614 | Świątniki Górne, gm. | 6984 | 1734 | 1734 | 1717 | 7 | 0.41 | |
| 120615 | Wielka Wieś, gm. | 7562 | 2017 | 2017 | 1985 | 6 | 0.30 | |
| 120616 | Zabierzów, gm. | 18514 | 5782 | 5769 | 5705 | 11 | 0.19 | |
| 120617 | Zielonki, gm. | 12712 | 4092 | 4092 | 4014 | 12 | 0.30 | |
| |
krakowski |
197081 |
47802 |
47764 |
46980 |
191 |
0.41 |
 |
|
| |
| . |
. |
Voting Results by location of ward electoral commission. |
. |
. |
| . |
. |
| . |
. |
. |
. |
. |
. |
. |
. |
. |
. |
. |
. |
. |
| No. |
Name |
No. of entitled
to vote |
No. of ballot
papers issued |
No. of votes |
No. of votes: per list / valid [%] |
| total |
valid |
per List |
| 1 | City | 36917 | 10853 | 10846 | 10697 | 49 | 0.46 | |
| 2 | Country | 160164 | 36949 | 36918 | 36283 | 142 | 0.39 | |
| . |
Voting Results by number of inhabitants of commune |
. |
| 1 | to 5 000 | 0 | 0 | 0 | 0 | 0 | 0.00 | |
| 2 | from 5 001 to 10 000 | 45784 | 10072 | 10066 | 9902 | 37 | 0.37 | |
| 3 | from 10 001 to 20 000 | 73841 | 17102 | 17095 | 16777 | 78 | 0.46 | |
| 4 | from 20 001 to 50 000 | 77456 | 20628 | 20603 | 20301 | 76 | 0.37 | |
| 5 | from 50 001 to 100 000 | 0 | 0 | 0 | 0 | 0 | 0.00 | |
| 6 | from 100 001 to 200 000 | 0 | 0 | 0 | 0 | 0 | 0.00 | |
| 7 | from 200 001 to 500 000 | 0 | 0 | 0 | 0 | 0 | 0.00 | |
| 8 | over 500 000 | 0 | 0 | 0 | 0 | 0 | 0.00 | |
|
|


 Statistical DataLegal ActsElectoral BodiesElection Committees and CandidatesTurnoutResultsSearchDocumentsCreated by