|
|
| . |
. |
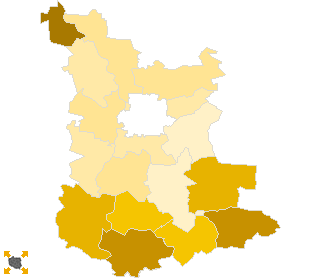
Voting Results for Committee. |
. |
. |
| . |
. |
| . |
. |
. |
. |
. |
. |
. |
. |
. |
. |
. |
. |
. |
| No. |
Name |
No. of entitled
to vote |
No. of ballot papers
issued |
No. of votes |
No. of votes: per list / valid [%] |
| total |
valid |
per List |
| 121601 | Ciężkowice, gm. | 8612 | 1644 | 1643 | 1596 | 17 | 1.07 |  |
| 121602 | Gromnik, gm. | 6501 | 1460 | 1460 | 1416 | 13 | 0.92 | |
| 121603 | Lisia Góra, gm. | 10550 | 2471 | 2468 | 2411 | 13 | 0.54 | |
| 121604 | Pleśna, gm. | 8953 | 2036 | 2035 | 1984 | 10 | 0.50 | |
| 121605 | Radłów, gm. | 7642 | 1316 | 1315 | 1281 | 5 | 0.39 | |
| 121606 | Ryglice, gm. | 8656 | 1900 | 1899 | 1835 | 18 | 0.98 | |
| 121607 | Rzepiennik Strzyżewski, gm. | 5237 | 1070 | 1070 | 1046 | 10 | 0.96 | |
| 121608 | Skrzyszów, gm. | 10202 | 2351 | 2351 | 2292 | 6 | 0.26 | |
| 121616 | Szerzyny, gm. | 6354 | 1164 | 1163 | 1142 | 13 | 1.14 | |
| 121609 | Tarnów, gm. | 18154 | 5262 | 5260 | 5151 | 20 | 0.39 | |
| 121610 | Tuchów, gm. | 13705 | 3715 | 3715 | 3618 | 13 | 0.36 | |
| 121611 | Wierzchosławice, gm. | 8107 | 2173 | 2173 | 2131 | 11 | 0.52 | |
| 121612 | Wietrzychowice, gm. | 3285 | 757 | 757 | 717 | 9 | 1.26 | |
| 121613 | Wojnicz, gm. | 10102 | 2521 | 2515 | 2451 | 10 | 0.41 | |
| 121614 | Zakliczyn, gm. | 9324 | 1853 | 1853 | 1800 | 18 | 1.00 | |
| 121615 | Żabno, gm. | 14857 | 3377 | 3373 | 3299 | 17 | 0.52 | |
| |
tarnowski |
150241 |
35070 |
35050 |
34170 |
203 |
0.59 |
 |
|
| |
| . |
. |
Voting Results by location of ward electoral commission. |
. |
. |
| . |
. |
| . |
. |
. |
. |
. |
. |
. |
. |
. |
. |
. |
. |
. |
| No. |
Name |
No. of entitled
to vote |
No. of ballot
papers issued |
No. of votes |
No. of votes: per list / valid [%] |
| total |
valid |
per List |
| 1 | City | 22412 | 6193 | 6189 | 6027 | 35 | 0.58 | |
| 2 | Country | 127829 | 28877 | 28861 | 28143 | 168 | 0.60 | |
| . |
Voting Results by number of inhabitants of commune |
. |
| 1 | to 5 000 | 3285 | 757 | 757 | 717 | 9 | 1.26 | |
| 2 | from 5 001 to 10 000 | 25734 | 5010 | 5008 | 4885 | 41 | 0.84 | |
| 3 | from 10 001 to 20 000 | 103068 | 24041 | 24025 | 23417 | 133 | 0.57 | |
| 4 | from 20 001 to 50 000 | 18154 | 5262 | 5260 | 5151 | 20 | 0.39 | |
| 5 | from 50 001 to 100 000 | 0 | 0 | 0 | 0 | 0 | 0.00 | |
| 6 | from 100 001 to 200 000 | 0 | 0 | 0 | 0 | 0 | 0.00 | |
| 7 | from 200 001 to 500 000 | 0 | 0 | 0 | 0 | 0 | 0.00 | |
| 8 | over 500 000 | 0 | 0 | 0 | 0 | 0 | 0.00 | |
|
|


 Statistical DataLegal ActsElectoral BodiesElection Committees and CandidatesTurnoutResultsSearchDocumentsCreated by