|
|
| . |
. |
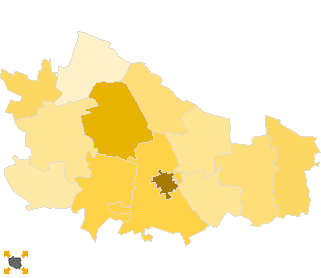
Voting Results for Committee. |
. |
. |
| . |
. |
| . |
. |
. |
. |
. |
. |
. |
. |
. |
. |
. |
. |
. |
| No. |
Name |
No. of entitled
to vote |
No. of ballot papers
issued |
No. of votes |
No. of votes: per list / valid [%] |
| total |
valid |
per List |
| 060802 | Abramów, gm. | 3490 | 728 | 728 | 717 | 13 | 1.81 |  |
| 060803 | Firlej, gm. | 4797 | 757 | 757 | 734 | 41 | 5.59 | |
| 060804 | Jeziorzany, gm. | 2480 | 368 | 368 | 361 | 13 | 3.60 | |
| 060805 | Kamionka, gm. | 5072 | 866 | 866 | 834 | 38 | 4.56 | |
| 060806 | Kock, gm. | 5450 | 977 | 977 | 948 | 11 | 1.16 | |
| 060807 | Lubartów, gm. | 8115 | 1503 | 1499 | 1458 | 60 | 4.12 | |
| 060801 | Lubartów, m. | 18712 | 4928 | 4916 | 4860 | 341 | 7.02 | |
| 060808 | Michów, gm. | 5137 | 835 | 835 | 821 | 24 | 2.92 | |
| 060809 | Niedźwiada, gm. | 4999 | 877 | 877 | 850 | 22 | 2.59 | |
| 060810 | Ostrów Lubelski, gm. | 4398 | 896 | 893 | 870 | 28 | 3.22 | |
| 060811 | Ostrówek, gm. | 3324 | 521 | 518 | 508 | 17 | 3.35 | |
| 060812 | Serniki, gm. | 3803 | 689 | 689 | 674 | 19 | 2.82 | |
| 060813 | Uścimów, gm. | 2726 | 525 | 525 | 509 | 18 | 3.54 | |
| |
lubartowski |
72503 |
14470 |
14448 |
14144 |
645 |
4.56 |
 |
|
| |
| . |
. |
Voting Results by location of ward electoral commission. |
. |
. |
| . |
. |
| . |
. |
. |
. |
. |
. |
. |
. |
. |
. |
. |
. |
. |
| No. |
Name |
No. of entitled
to vote |
No. of ballot
papers issued |
No. of votes |
No. of votes: per list / valid [%] |
| total |
valid |
per List |
| 1 | City | 23555 | 5991 | 5979 | 5896 | 363 | 6.16 | |
| 2 | Country | 48948 | 8479 | 8469 | 8248 | 282 | 3.42 | |
| . |
Voting Results by number of inhabitants of commune |
. |
| 1 | to 5 000 | 15823 | 2831 | 2828 | 2769 | 80 | 2.89 | |
| 2 | from 5 001 to 10 000 | 29853 | 5208 | 5205 | 5057 | 164 | 3.24 | |
| 3 | from 10 001 to 20 000 | 8115 | 1503 | 1499 | 1458 | 60 | 4.12 | |
| 4 | from 20 001 to 50 000 | 18712 | 4928 | 4916 | 4860 | 341 | 7.02 | |
| 5 | from 50 001 to 100 000 | 0 | 0 | 0 | 0 | 0 | 0.00 | |
| 6 | from 100 001 to 200 000 | 0 | 0 | 0 | 0 | 0 | 0.00 | |
| 7 | from 200 001 to 500 000 | 0 | 0 | 0 | 0 | 0 | 0.00 | |
| 8 | over 500 000 | 0 | 0 | 0 | 0 | 0 | 0.00 | |
|
|


 Statistical DataLegal ActsElectoral BodiesElection Committees and CandidatesTurnoutResultsSearchDocumentsCreated by