|
|
| . |
. |
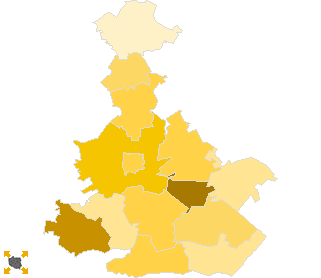
Voting Results for Committee. |
. |
. |
| . |
. |
| . |
. |
. |
. |
. |
. |
. |
. |
. |
. |
. |
. |
. |
| No. |
Name |
No. of entitled
to vote |
No. of ballot papers
issued |
No. of votes |
No. of votes: per list / valid [%] |
| total |
valid |
per List |
| 060202 | Aleksandrów, gm. | 2484 | 513 | 513 | 498 | 269 | 54.02 |  |
| 060203 | Biłgoraj, gm. | 10018 | 1958 | 1958 | 1918 | 824 | 42.96 | |
| 060201 | Biłgoraj, m. | 21985 | 5483 | 5482 | 5404 | 2081 | 38.51 | |
| 060204 | Biszcza, gm. | 3174 | 700 | 700 | 689 | 211 | 30.62 | |
| 060205 | Frampol, gm. | 5258 | 950 | 950 | 928 | 361 | 38.90 | |
| 060206 | Goraj, gm. | 3607 | 589 | 589 | 573 | 209 | 36.47 | |
| 060207 | Józefów, gm. | 5876 | 1112 | 1112 | 1073 | 337 | 31.41 | |
| 060208 | Księżpol, gm. | 5270 | 756 | 756 | 730 | 292 | 40.00 | |
| 060209 | Łukowa, gm. | 3508 | 702 | 702 | 684 | 239 | 34.94 | |
| 060210 | Obsza, gm. | 3492 | 654 | 654 | 651 | 194 | 29.80 | |
| 060211 | Potok Górny, gm. | 4481 | 831 | 831 | 817 | 411 | 50.31 | |
| 060212 | Tarnogród, gm. | 5617 | 1256 | 1256 | 1225 | 483 | 39.43 | |
| 060213 | Tereszpol, gm. | 3171 | 423 | 423 | 416 | 165 | 39.66 | |
| 060214 | Turobin, gm. | 5802 | 1352 | 1352 | 1308 | 290 | 22.17 | |
| |
biłgorajski |
83743 |
17279 |
17278 |
16914 |
6366 |
37.64 |
 |
|
| |
| . |
. |
Voting Results by location of ward electoral commission. |
. |
. |
| . |
. |
| . |
. |
. |
. |
. |
. |
. |
. |
. |
. |
. |
. |
. |
| No. |
Name |
No. of entitled
to vote |
No. of ballot
papers issued |
No. of votes |
No. of votes: per list / valid [%] |
| total |
valid |
per List |
| 1 | City | 29171 | 7243 | 7242 | 7110 | 2688 | 37.81 | |
| 2 | Country | 54572 | 10036 | 10036 | 9804 | 3678 | 37.52 | |
| . |
Voting Results by number of inhabitants of commune |
. |
| 1 | to 5 000 | 19436 | 3581 | 3581 | 3511 | 1287 | 36.66 | |
| 2 | from 5 001 to 10 000 | 32304 | 6257 | 6257 | 6081 | 2174 | 35.75 | |
| 3 | from 10 001 to 20 000 | 10018 | 1958 | 1958 | 1918 | 824 | 42.96 | |
| 4 | from 20 001 to 50 000 | 21985 | 5483 | 5482 | 5404 | 2081 | 38.51 | |
| 5 | from 50 001 to 100 000 | 0 | 0 | 0 | 0 | 0 | 0.00 | |
| 6 | from 100 001 to 200 000 | 0 | 0 | 0 | 0 | 0 | 0.00 | |
| 7 | from 200 001 to 500 000 | 0 | 0 | 0 | 0 | 0 | 0.00 | |
| 8 | over 500 000 | 0 | 0 | 0 | 0 | 0 | 0.00 | |
|
|


 Statistical DataLegal ActsElectoral BodiesElection Committees and CandidatesTurnoutResultsSearchDocumentsCreated by