|
|
| . |
. |
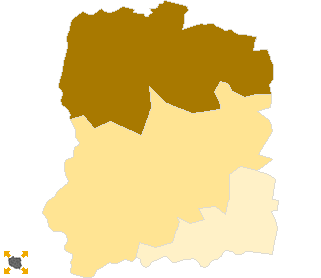
Voting Results for Committee. |
. |
. |
| . |
. |
| . |
. |
. |
. |
. |
. |
. |
. |
. |
. |
. |
. |
. |
| No. |
Name |
No. of entitled
to vote |
No. of ballot papers
issued |
No. of votes |
No. of votes: per list / valid [%] |
| total |
valid |
per List |
| 022201 | Brzeg Dolny, gm. | 13244 | 2862 | 2848 | 2806 | 53 | 1.89 |  |
| 022202 | Wińsko, gm. | 6975 | 926 | 926 | 895 | 38 | 4.25 |  |
| 022203 | Wołów, gm. | 19836 | 4134 | 4129 | 4015 | 99 | 2.47 |  |
| |
wołowski |
40055 |
7922 |
7903 |
7716 |
190 |
2.46 |
 |
|
| |
| . |
. |
Voting Results by location of ward electoral commission. |
. |
. |
| . |
. |
| . |
. |
. |
. |
. |
. |
. |
. |
. |
. |
. |
. |
. |
| No. |
Name |
No. of entitled
to vote |
No. of ballot
papers issued |
No. of votes |
No. of votes: per list / valid [%] |
| total |
valid |
per List |
| 1 | City | 22727 | 5377 | 5360 | 5250 | 68 | 1.30 |  |
| 2 | Country | 17328 | 2545 | 2543 | 2466 | 122 | 4.95 |  |
| . |
Voting Results by number of inhabitants of commune |
. |
| 1 | to 5 000 | 0 | 0 | 0 | 0 | 0 | 0.00 | |
| 2 | from 5 001 to 10 000 | 6975 | 926 | 926 | 895 | 38 | 4.25 |  |
| 3 | from 10 001 to 20 000 | 13244 | 2862 | 2848 | 2806 | 53 | 1.89 |  |
| 4 | from 20 001 to 50 000 | 19836 | 4134 | 4129 | 4015 | 99 | 2.47 |  |
| 5 | from 50 001 to 100 000 | 0 | 0 | 0 | 0 | 0 | 0.00 | |
| 6 | from 100 001 to 200 000 | 0 | 0 | 0 | 0 | 0 | 0.00 | |
| 7 | from 200 001 to 500 000 | 0 | 0 | 0 | 0 | 0 | 0.00 | |
| 8 | over 500 000 | 0 | 0 | 0 | 0 | 0 | 0.00 | |
|
|


 Statistical DataLegal ActsElectoral BodiesElection Committees and CandidatesTurnoutResultsSearchDocumentsCreated by
 Statistical Data Legal Acts Electoral Bodies Election Committees and Candidates Turnout Results Search Documents Created by


