|
|
|
|
| |
| . |
. |
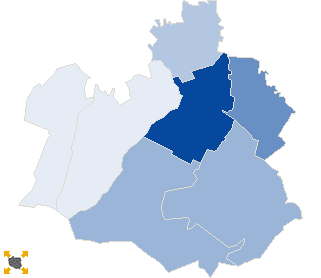
Turnout by location of ward electoral commission |
. |
. |
| . |
. |
| . |
. |
. |
. |
. |
. |
. |
. |
. |
. |
. |
. |
| No. |
Name |
No. entitled
to vote |
No. of ballot
papers issued |
No. of |
No. of total votes / No. entitled to vote
[%] |
| total votes |
valid votes |
| 1 | City | 11055 | 2626 | 2616 | 2592 | 23.66 |  |
| 2 | Country | 27606 | 6684 | 6680 | 6570 | 24.20 | |
| . |
Turnout by number of inhabitants of commune |
. |
| 1 | to 5 000 | 5339 | 1327 | 1324 | 1304 | 24.80 | |
| 2 | from 5 001 to 10 000 | 19921 | 4699 | 4698 | 4622 | 23.58 | |
| 3 | from 10 001 to 20 000 | 13401 | 3284 | 3274 | 3236 | 24.43 | |
| 4 | from 20 001 to 50 000 | 0 | 0 | 0 | 0 | 0.00 | |
| 5 | from 50 001 to 100 000 | 0 | 0 | 0 | 0 | 0.00 | |
| 6 | from 100 001 to 200 000 | 0 | 0 | 0 | 0 | 0.00 | |
| 7 | from 200 001 to 500 000 | 0 | 0 | 0 | 0 | 0.00 | |
| 8 | over 500 000 | 0 | 0 | 0 | 0 | 0.00 | |
|
|


 Statistical DataLegal ActsElectoral BodiesElection Committees and CandidatesTurnoutResultsSearchDocumentsCreated by